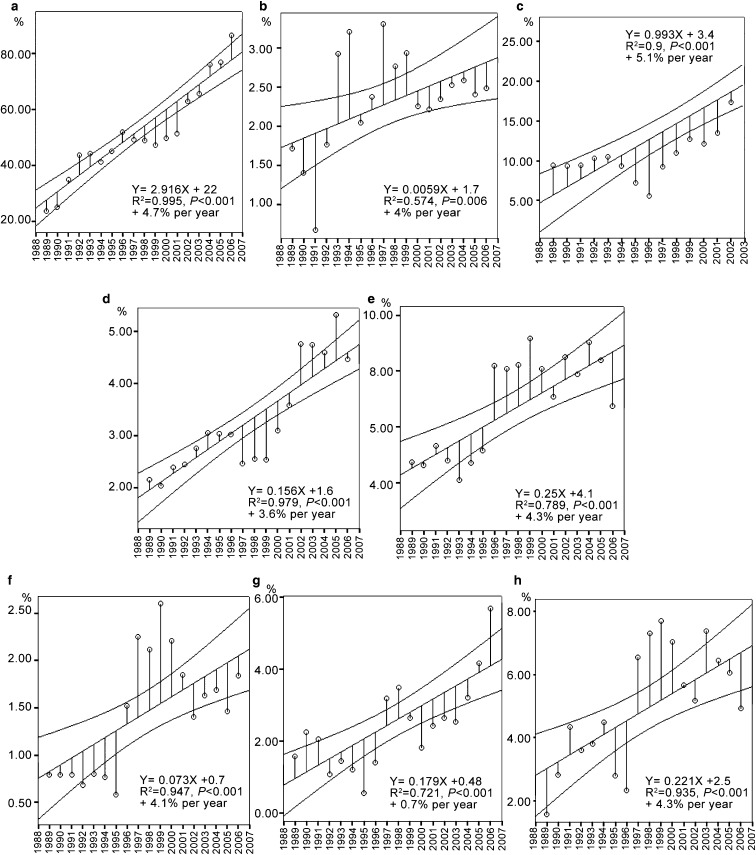
Figure 2.
Linear regression lines of the mean per year of morphological abnormalities which change significantly over the study. For each parameter, the graph shows the linear regression line with 95% confidence interval over the study period. For the percentage of spermatozoa with bent tail, results are showed until the end of 2002: (a) amorphous head; (b) multiple head; (c) bent tail; (d) tailless head; (e) headless tail; (f) multiple tail; (g) thin head; (h) cytoplasmic droplet.

