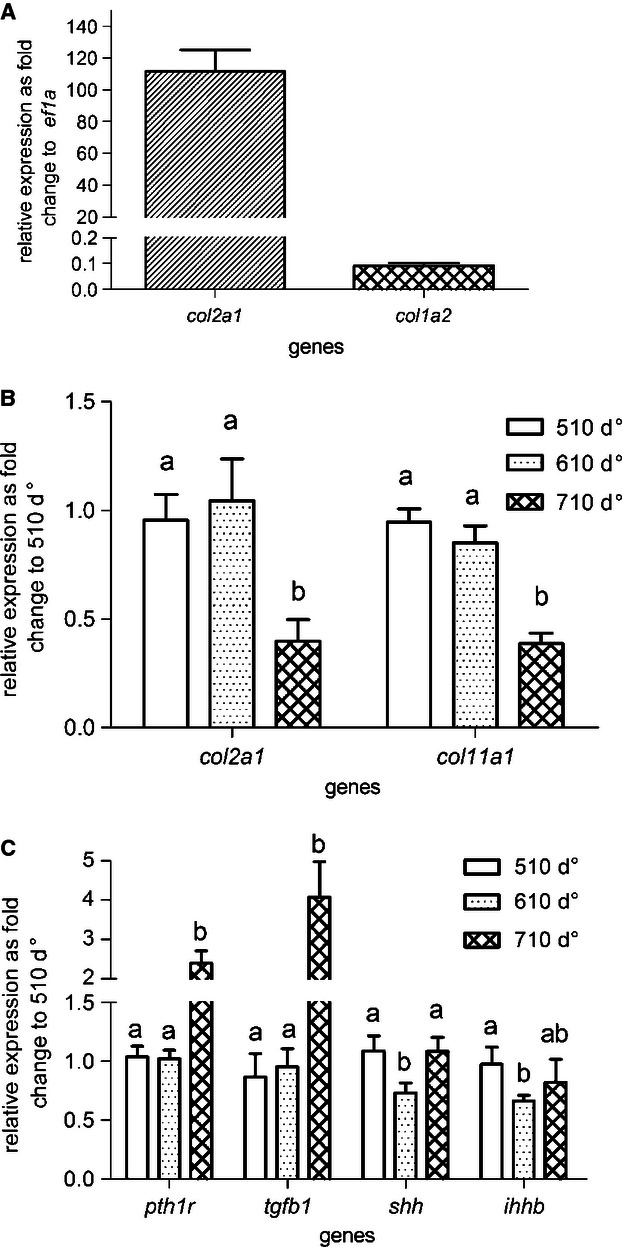
Fig. 6.

Relative gene expression using qPCR at selected developmental stages (510, 610 and 710 d°). The relative expression of collagens col2a1 and col1a2 as fold change to reference gene ef1a in all stages (A). Relative expression of collagens col2a1 and col11a1 (B) and signalling genes pth1r, tgfb1, shh and ihhb (C) grouped by developmental stages as fold change to 510 d°. In pairwise comparison within one gene, a and b indicate a significant difference (P < 0.01), whereas ab shows that there was no significant differences from either a or b. Error bar indicates mean ± SD.
