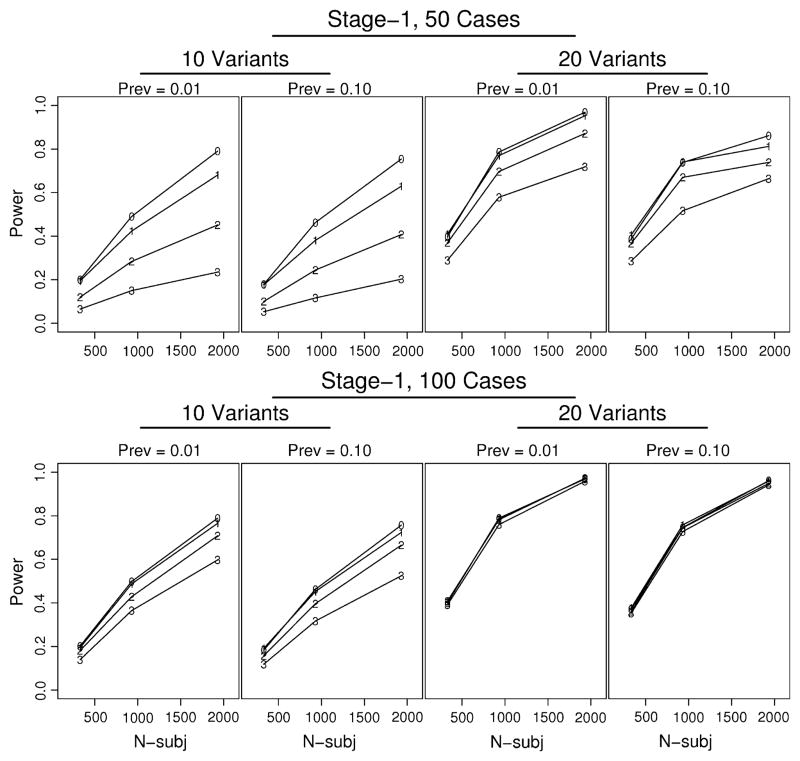
Fig. 4.
Unconditional power for representative simulations (scenario-5, OR = 2) illustrating impact on power of threshold at stage-1 (labels 0–3 in panels), number of cases screened at stage-1 (50 in top panels; 100 in bottom panels), disease prevalence (Prev), and number of variants (10 or 20). x-axis “N-subj” is the total number of subjects

