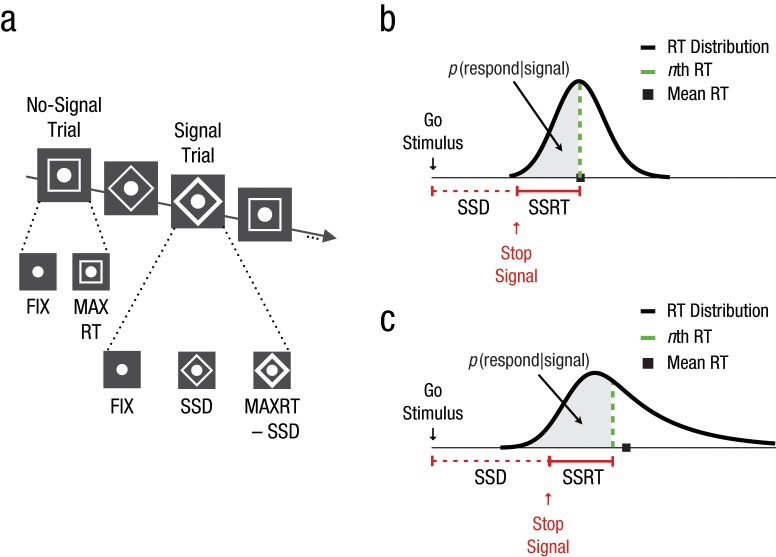
Fig. 1.
Experimental paradigm. In the stop-signal task (a), participants perform a go task (e.g., responding to the shape of a go stimulus). On a minority of the trials, the go stimulus is followed by a stop signal (e.g., the outline of the shape turning bold) after a variable stop-signal delay (SSD); this stop signal instructs the subject to withhold the planned response. FIX = presentation duration of the fixation sign; MAXRT = response deadline. A graphic representation of the assumptions of the independent-horse-race model of Logan and Cowan (1984; b) indicates how the probability of responding, p(respond|signal), depends on the distribution of go reaction time, SSD, and stop-signal reaction time (SSRT). In this example, p(respond|signal) = .50. The dashed line corresponds to the nth percentile, with n equal to p(respond|signal) multiplied by 100. When the distribution is skewed to the right, as in (c), there is a substantial difference between the mean and the nth RT; this may influence the SSRT estimations.

