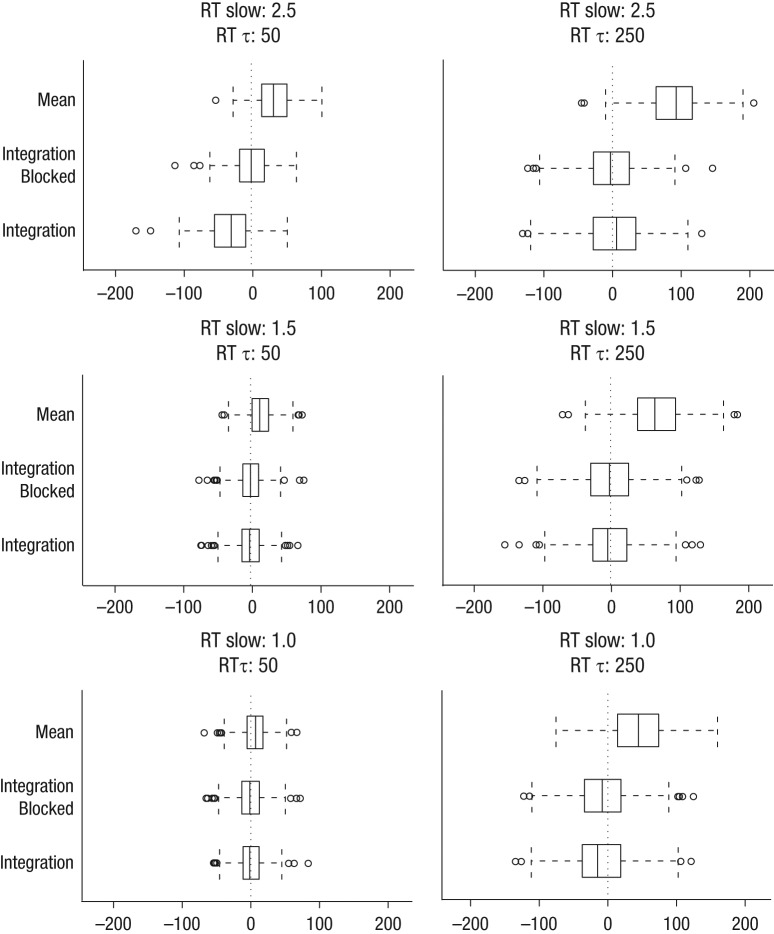
Fig. 3.
Box plots showing the difference between the estimated stop latency and the true stop latency in the second set of simulations. For each combination of reaction time (RT) τ and response slowing, estimates are shown for estimates based on the mean, integration blocked, and integration models. Negative values indicate that the estimated value is an underestimation of the true stop-signal reaction time (SSRT); positive values indicate that the estimated SSRT is longer than the actual stop latency. In each box, the solid lines show the medians, and the left and right edges mark the lowest and highest quartiles, respectively. The dashed lines with the whiskers at their respective end points capture the location of extreme values. Outliers exceeding the interquartile distance (from one end of the box to the other) by more than 1.5 are represented by circles.

