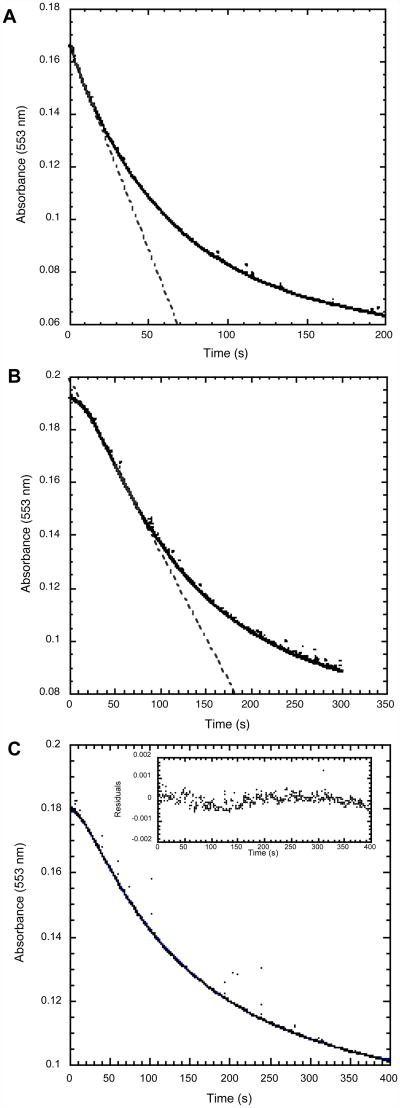
Figure 5.
Comparison of peroxidase catalytic activity using So cyt c5 (4 μM) as the electron donor for (A) semi-reduced tag-free So CcP and (B & C) oxidized tag-free So CcP. Experiments are conducted in 5 mM MES, 5 mM HEPES, 10 mM NaCl, 1 mM CaCl2 (pH 6.0) at 23°C. In A & B, points represent the data and a line represents the linear rate used for Michaelis-Menten analysis. Pane C compares the experimental data (points) to the least-square fit of the data to the kinetic model (line) as described in the text. The inset in (C) shows the residuals of the least-square fit.

