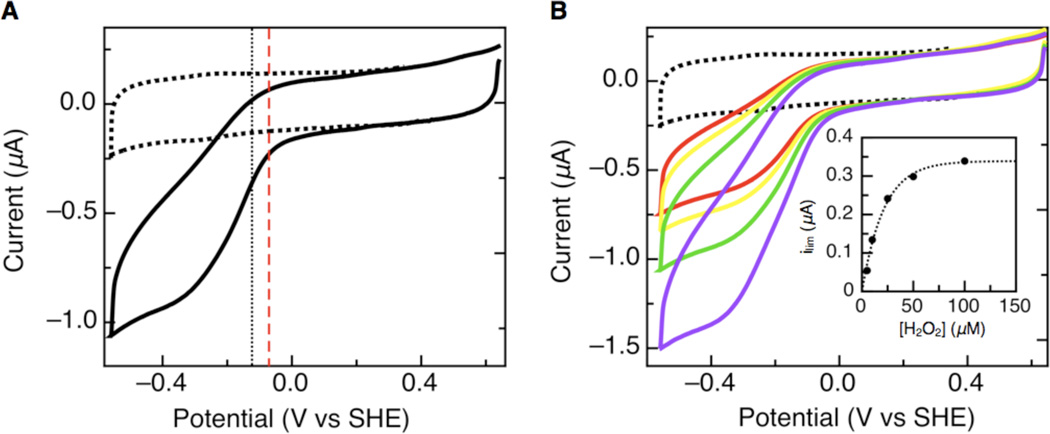
Figure 2.
Electrocatalytic reduction of hydrogen peroxide at a PGE electrode with wild-type G. sulfurreducens CcpA adsorbed onto the graphite electrode surface. (A) Voltammogram collected for wild-type G. sulfurreducens CcpA with 25 µM peroxide in the cell solution. The dotted voltammogram is the baseline before the addition of peroxide. The vertical black dotted line represents the catalytic potentials for wild-type G. sulfurreducens CcpA and the dashed red line shows the P. aeruginosa CcP catalytic potential for comparison. (B) Voltammograms collected for increasing concentrations of peroxide in the cell solution (red = 5 µM, yellow = 10 µM, green = 25 µM, purple = 50 µM). The inset shows the calculation of Km for voltammograms collected at a specific pH. (Experimental conditions: pH 7, scan rate = 20 mV/s, rotation rate = 1000 rpm.)

