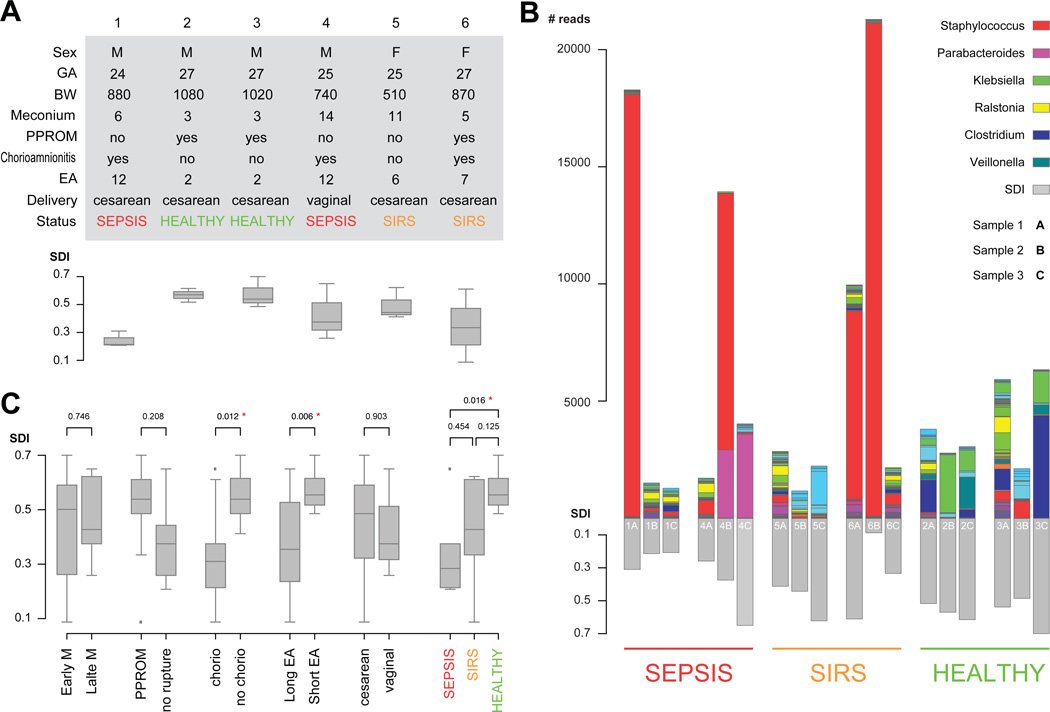
Figure 1.
Subject clinical variables, sample level stacked bar plots of the most common taxonomical units and comparison of Shannon diversity indices by clinical variable. (A) Subject table of clinical variables. BW, birth weight, grams; EA, early antibiotics, days; GA, gestational age, weeks; PPROM, preterm premature rupture of membranes; SDI, Simpson diversity index at the sample level. (B) Sample level stacked bar plots. The legend shows the colour scheme for the six most abundant genera. Samples are grouped by clinical outcome and ordered sequentially for each patient. Three of the patients show samples with high abundance of Staphylococcus. Patients 2 and 3 show unusually high abundance of Veillonella and Clostridium when compared with the rest of the patients. (C) Patients comparisons based on patient subgroups. p Values are derived from pairwise t-tests, red asterisks indicate statistical significance based on 0.05 threshold. Box plots show the minimum, quartiles, median and maximum SDI values.

