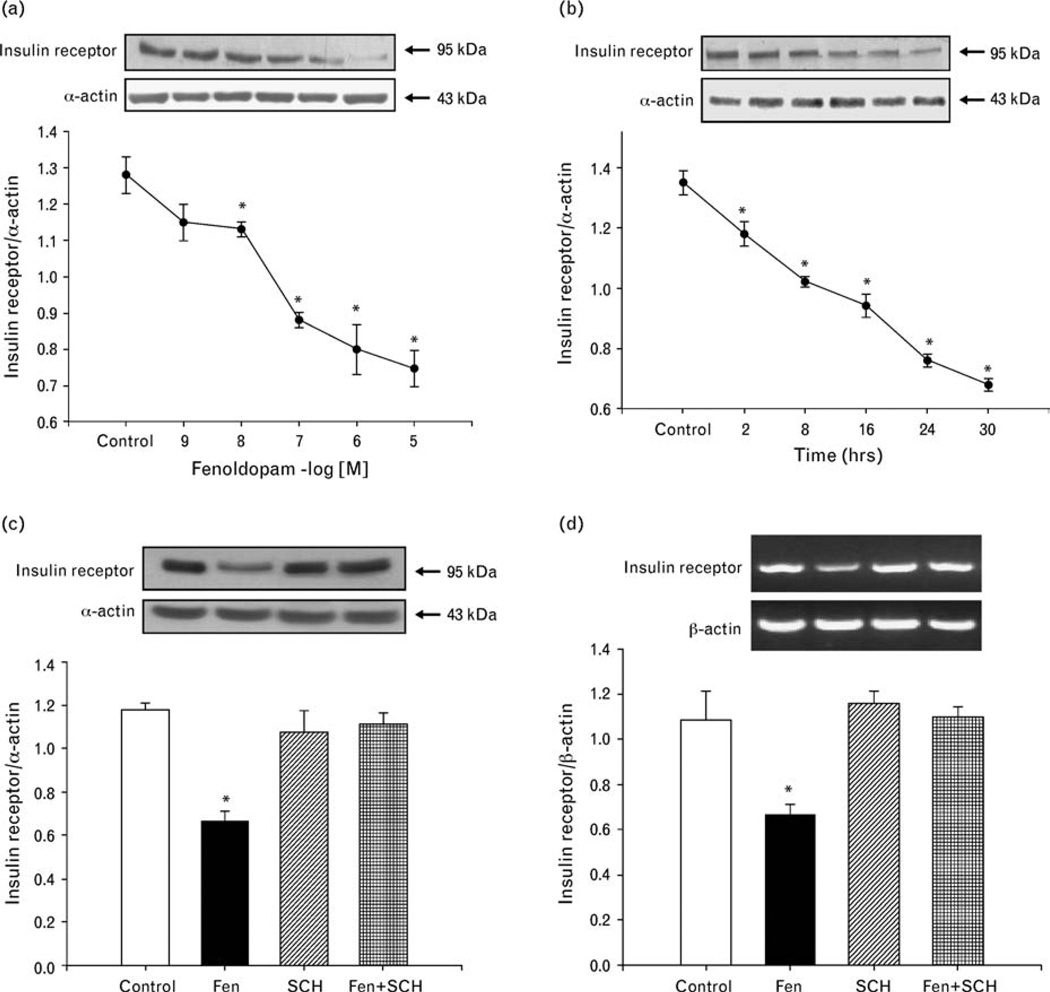
Fig. 3.
Effect of D1-like receptor stimulation on insulin receptor expression in A10 cells. (a) Concentration-dependent effect of a D1-like receptor agonist, fenoldopam, on insulin receptor protein expression in A10 cells. The control is vehicle (dH2O) in this figure. Immunoreactive insulin receptor band was quantified after 24-h incubation with the indicated concentrations of fenoldopam (10−9 mol/l−10−5 mol/l). Results are expressed as the ratio of insulin receptor (as a fraction of 100%), to α-actin (as a fraction of 100%) densities (n = 4, *P<0.05 vs. control (dH2O), ANOVA, Duncan’s test). (b) Time-course of the effect of a D1-like receptor agonist, fenoldopam, on insulin receptor protein expression in A10 cells. The cells were incubated at the indicated times with 10−6 mol/l fenoldopam. The control is vehicle (dH2O) in this figure. Results are expressed as the ratio of insulin receptor (as a fraction of 100%), to α-actin (as a fraction of 100%) (n = 4, *P<0.05 vs. control [0 time], ANOVA, Duncan’s test). (c and d) Effect of a D1-like receptor agonist (fenoldopam) and a D1-like receptor antagonist (SCH23390) on insulin receptor protein (c) and mRNA (d) expression in A10 cells. The cells were incubated with the indicated reagents (fenoldopam, 10−6 mol/l; SCH23390, 10−6 mol/l) for 24 h. The control is vehicle (dH2O) in this figure. Results are expressed as the ratio of insulin receptor (as a fraction of 100%) to α-actin for immunoblotting or β-actin for RT-PCR (as a fraction of 100%) (n = 4, *P<0.05 vs. others, ANOVA, Duncan’s test).

