
Figure 2.
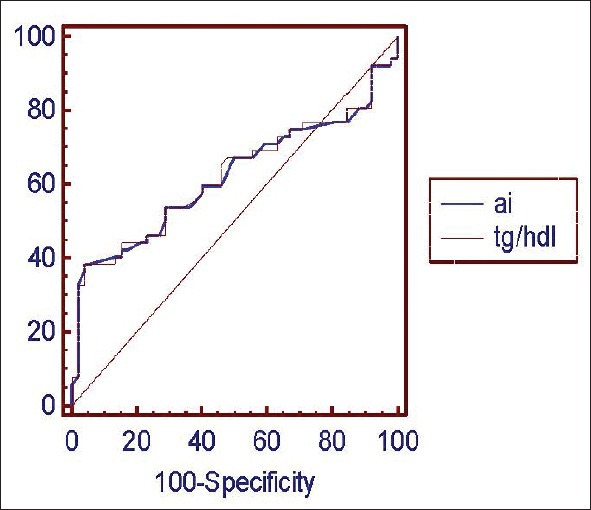
Receiver operating curve analysis showing high Area under curve values for atherogenic lipid risk factors; TG/HDL-C (AUC = 0.62, p = 0.03) and AI (AUC = 0.62, p = 0.03).
Official websites use .gov
A
.gov website belongs to an official
government organization in the United States.
Secure .gov websites use HTTPS
A lock (
) or https:// means you've safely
connected to the .gov website. Share sensitive
information only on official, secure websites.
Receiver operating curve analysis showing high Area under curve values for atherogenic lipid risk factors; TG/HDL-C (AUC = 0.62, p = 0.03) and AI (AUC = 0.62, p = 0.03).