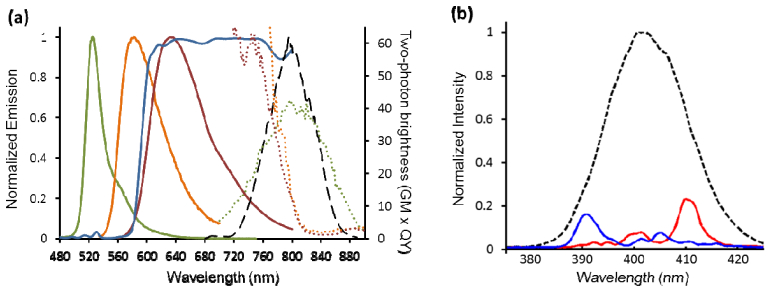
Fig. 2.

Fluorescent protein spectra and selective excitations. (a) Two-photon brightness (dotted curves) and fluorescence emission spectra (solid curves) of mAmetrine, TagRFPt and mKate2 are plotted in green, orange, and red, respectively (adapted from ref [30]). We note that TagRFPt, which was used in this study, is known to have a very similar spectral response to TagRFP shown here [43, 45]. Normalized spectrum of the broadband Ti:Sa laser is plotted in black (long dashed curve). The 595DCXR dichroic mirror transform function is plotted in blue. (b) SHG signal from a β-BaBO4 crystal for a TL pulse (dashed line) and two selective two-photon excitations with SHG centered at 390 nm (blue phase-shaped pulse, blue solid line) and 410 nm (red phase-shaped pulse, red solid line).
