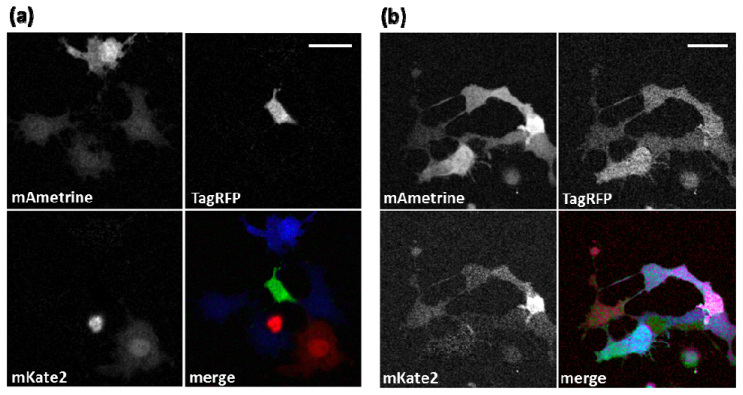
Fig. 4.

Linear unmixing. (a) Signal of mAmetrine, TagRFPt and mKate2 from Fig. 3 (middle and right columns) is restored in three separate images. (b) Pseudo-colored merge image of a sample co-expressing all three FPs after linear unmixing. In (a) and (b), mAmetrine, TagRFPt and mKate2 are pseudo-colored in blue, green and red in the merge image, respectively. Gamma correction (0.5) was applied to both panels in order to better present the dimly labeled cells. Scale bars are 20 µm.
