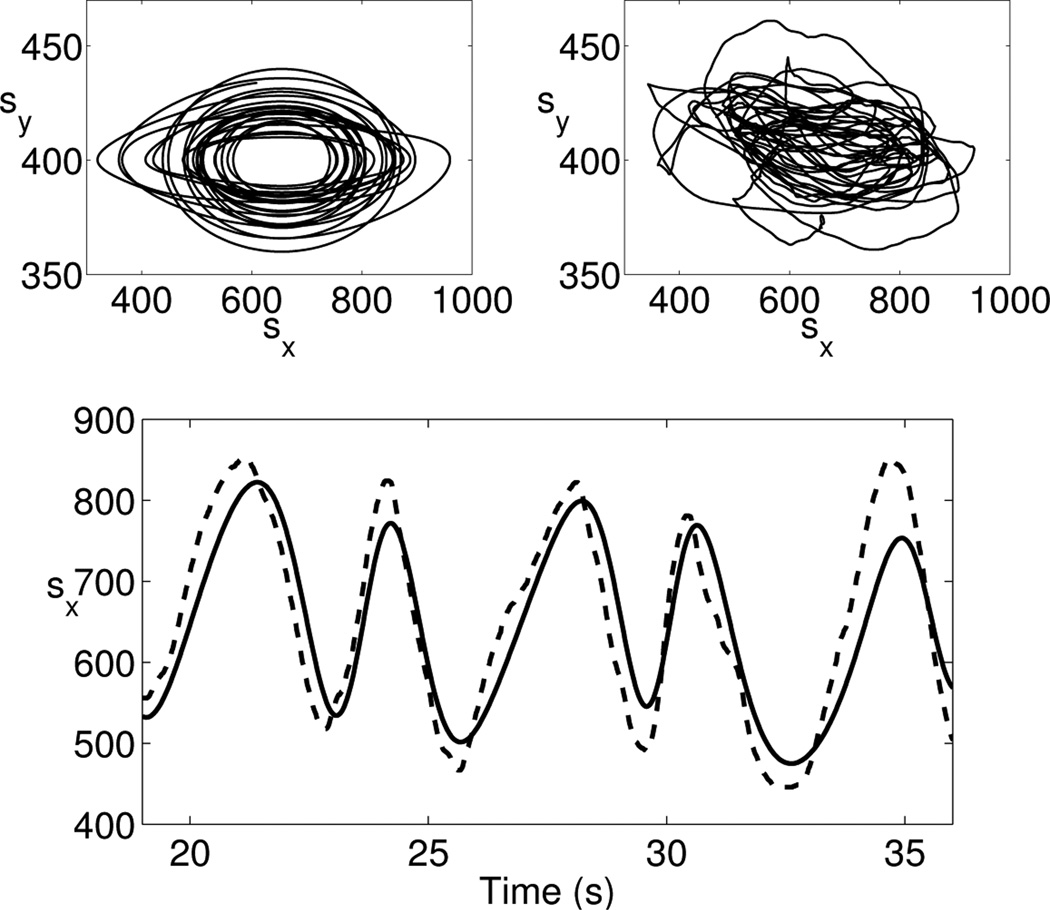
Fig. 1.
Typical time series for both target (top left) and participant (top right). In this particular trial, the target time series was generated with x3(0) = 18.6386, and the participant’s response was subjected to a delay of τ = 400 ms. The bottom panel contains a plot of the evolution of target (solid) and participant (dashed) together in time. A slight negative phase shift is evident, owing to the fact that the participant’s stylus is leading the target by approximately 180 ms on average.

