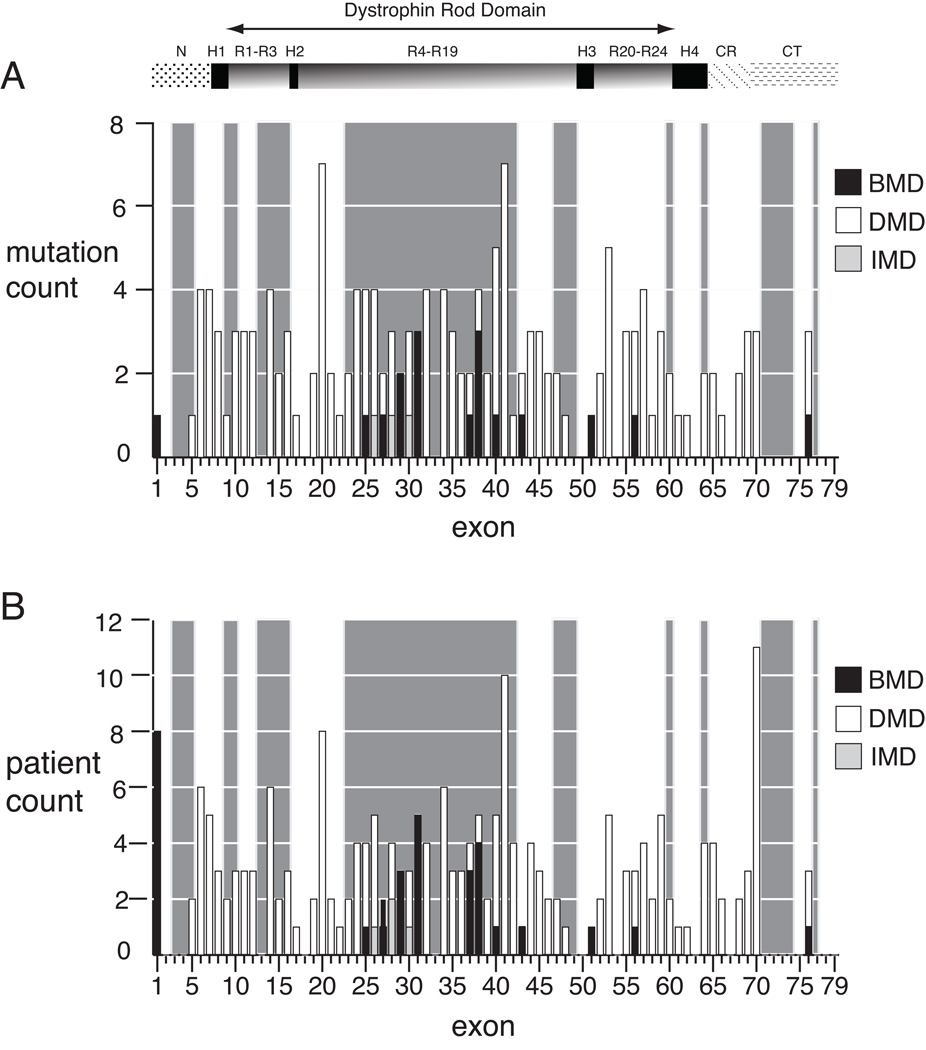
Figure 1.
Exon distribution of dystrophin nonsense mutations by phenotype. A) The number of mutations per exon for unique mutation sites (N=161) is shown for Duchenne (open boxes), intermediate (light boxes), and Becker (dark boxes) phenotypes. Exons with in-frame flanking exon context are highlighted by the light grey background shading, and for each exon within the shaded region, single exon skipping will result in bypass of the truncating mutation. Only a single mutation site (c.3500) is counted twice, due to a discrepant phenotype between kindreds, as discussed in the text. B) The number of mutations per exon by patient (N=210). The exon location of dystrophin protein domains are shown above the graphs: NH2 terminus (N), rod domain spectrin repeats 1 through 24 (R), rod domain hinges 1 through 4 (H), cysteine-rich domain (CR), carboxyl terminus (CT).

