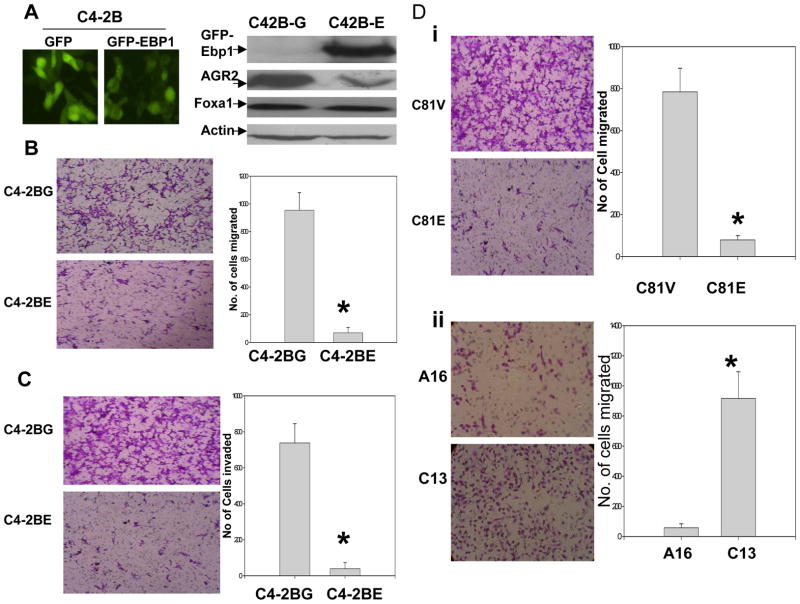
Figure 3. EBP1 modulates the expression of AGR2 accompanied by changes in motility and invasiveness in prostate cancer cells.
A, C4-2B cells stably expressing GFP(C4-2BG) or GFP-EBP1 fusion proteins(C4-2BE) were visualized by fluorescence microscopy(left panel) and confirmed by Western blotting assay using GFP antibody (right upper panel). AGR2 and Foxa1 levels were also analyzed in these cells and Actin was used as loading control (lower 3 panels). B, Left panel: Photomicrographs of Boyden Chamber membranes after migration assays showing that many C4-2BG but few C4-2BE cells traversed a coated membrane (left panel). Right panel: Quantification of the effects of EBP1 and AGR2 expression on migration. Columns= mean number of cells migrated in three representative fields per well. Bars=SD. Shown as one of three independent experiments. C. Invasion assay was described in Fig2. D & E, left panel, micrographs of Boyden chamber membranes after migration assays with C81V and C81E, A16 and C13. Right panel: relative quantification of the effects of EBP1 and AGR2 expression on the migration. Columns, mean number of cells migrated in three representative fields per well. Bars, SD (*, P<0.01 versus control, t test). Shown as one of three independent experiments.

