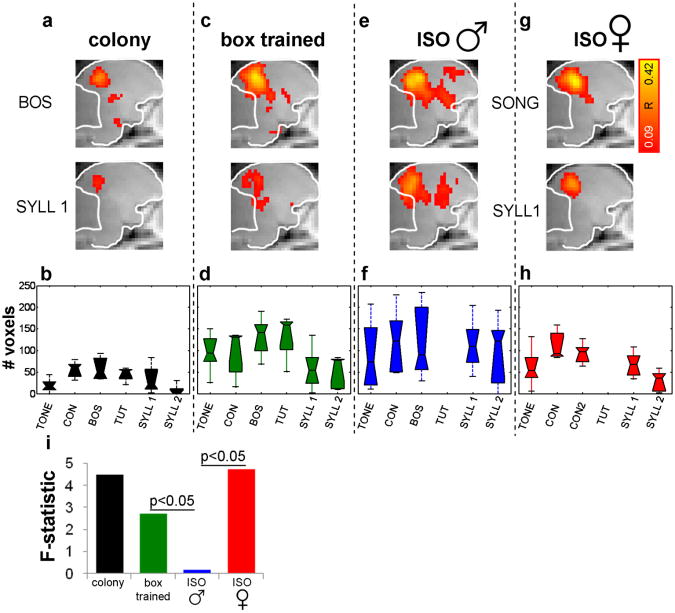
Figure 2.
Differences in BOLD activation to different stimuli. (a) BOLD activation maps for bird's own song (BOS) and repeated syllable (SYLL1) in colony males shows stronger activation to BOS. Each map shows average activity in left and right hemisphere 0.5 mm from midline (sagittal slices 4 &5); color scale shows correlation coefficient (see caption of Fig. 1). (b) Box plot summarizing BOLD activation across stimuli in colony males. Area of activation varies significantly across stimuli with greater activation to songs (ANOVA p < 0.01). Stimuli: 2 kHz pure tone, conspecific song (CON), bird's own song (BOS), tutor song (TUT), song syllables (SYLL 1, SYLL 2). All conspecific songs were produced by unfamiliar, colony raised birds. (c-d) Same as A-B for box-trained males (p < 0.05). (e-f) Same for isolated males, except that there is no tutor song (p = 0.9). (g-h) Same for isolate females (p < 0.05) with an additional conspecific song (CON2) to balance cross-group comparisons. (i) The F statistics of ANOVAs can be used to compare response patterns across groups. Bootstrap comparisons of response patterns show significance between box-trained and isolated males, and between isolated males and isolated females (p < 0.05, each comparison).

