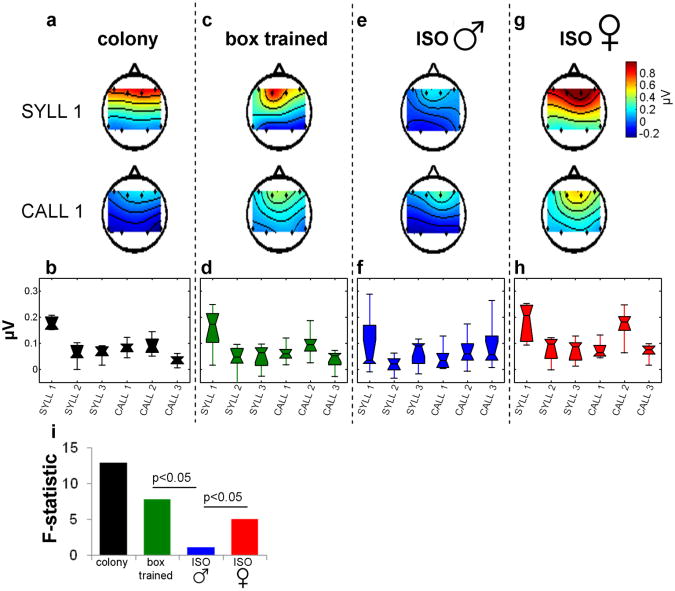
Figure 3.
Differences in ERP responses to different stimuli. (a) In colony males rostro-caudal potentials at stimulus onset (0-40 ms) vary by stimulus in two example stimuli. Color scale indicates amplitude of evoked potential at stimulus onset (ERP values averaged over 10-40 ms post-stimulus time-window). (b) Box plot summarizing ERP rostro-caudal potentials across stimuli in colony males. Potentials vary significantly across stimuli (ANOVA p < 0.01). Stimuli: syllables (SYLL 1, SYLL 2, SYLL 3) and female calls (CALL 1, CALL 2, CALL 3). (c-b) Same as A-B for box-trained males (p < 0.05). (e-f) Same for isolated males (p = 0.7), (g-h) Same for female isolates (p < 0.05). (i) The F statistics comparisons of response patterns show significance between box-trained and isolated males, and between isolated males and isolated females (p < 0.05, each comparison).

