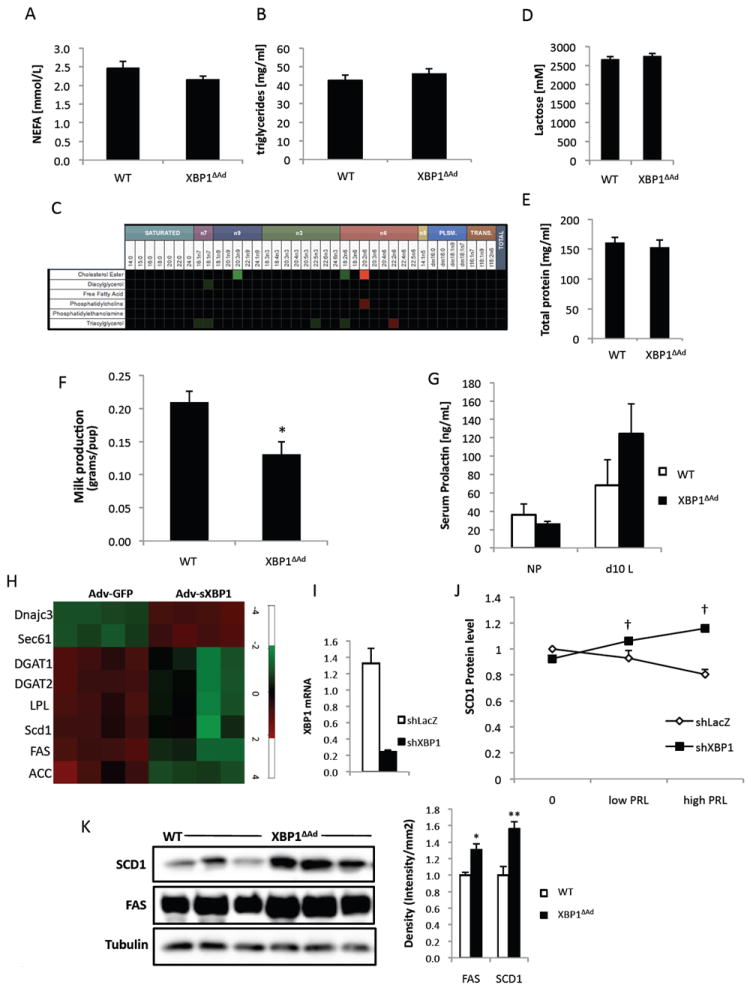
Figure 4. Adipocyte XBP1 affects milk quantity and lipogenic gene expression.

Milk was collected from WT and XBP1ΔAd dams at day 12 lactation. (A) non-esterified fatty acid (NEFA) and (B) triglyceride levels in milk. (C) Heatmap of lipidomics analysis in XBP1ΔAd and WT milk. (D) Lactose and (E) total protein concentrations in WT and XBP1ΔAd milk. (F) Milk quantitation assay. Amount of milk produced from each dam was measured as difference in pup weight before and after a controlled 1.5 hour feeding. Litters were pared to 6 pups. (G) Serum prolactin in NP and d10L WT and XBP1ΔAd mice. *p<0.02 using standard t-test. (H) Heatmap of gene expression from F442A adipocytes overexpressing sXBP1 or GFP control. (I) QPCR demonstrating suppression of Xbp1 mRNA by adenoviral shRNA. (J) Graph of densitometry data for protein levels of SCD1 in cultured adipocytes during low or high (50-500ng/ml) prolactin treatments. SCD1 protein levels were normalized to adiponectin. Basal WT SCD1 protein level was set at 1. (K) Western blot analysis of FAS, SCD1, and Tubulin proteins in gonadal adipose tissue from d10 lactation. Densitometry measures are provided in the graph to the right. All error bars indicate +/- SEM. *p<0.05, **p<0.004 using standard t-test. † denotes p<0.004 as measured by regular 2-way ANOVA. See also Figure S4.
