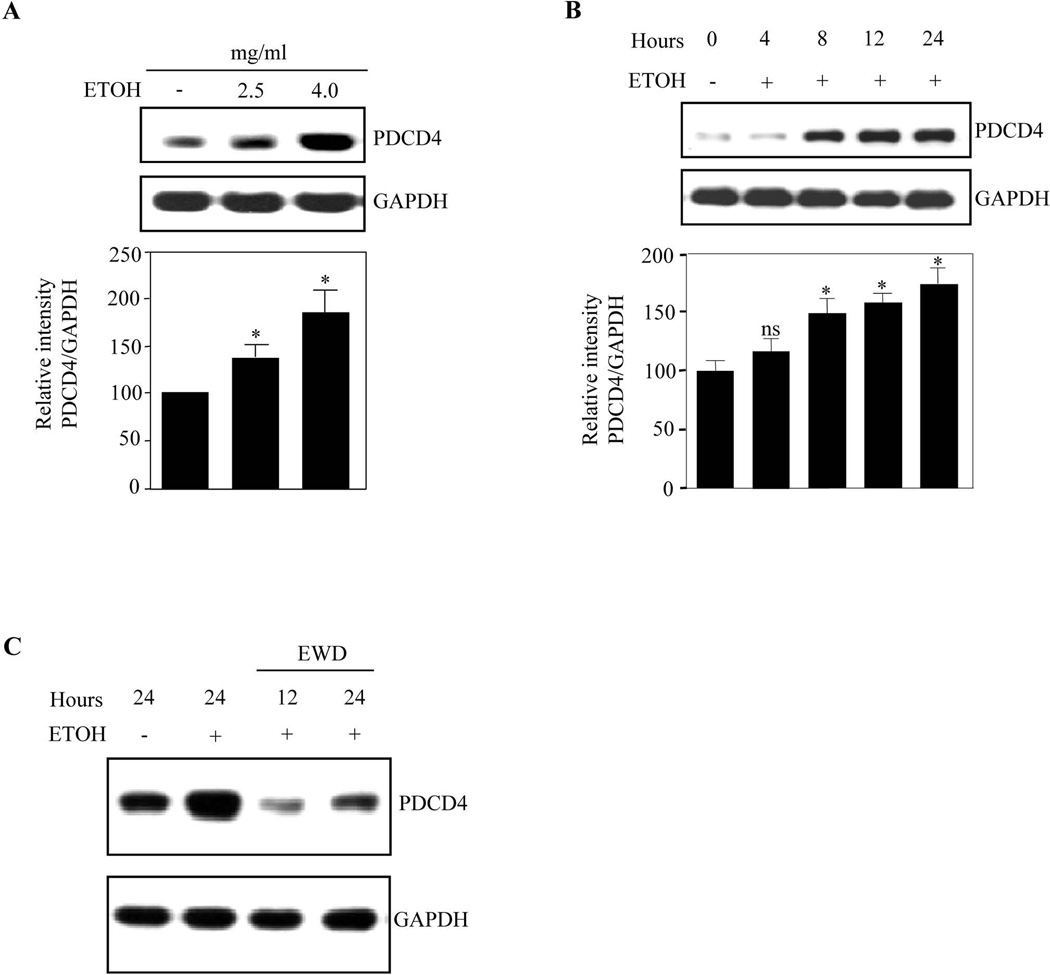
Figure 2. PDCD4 expression was strongly induced in PCN in response to ETOH.
(A) PCNs were treated with ETOH 2.5mg/ml and 4mg/ml for 24 h. PDCD4 protein expression was determined by immunoblot analyses. Immunoblotting with anti-GAPDH was used as loading control. Lower panel depicts densitometric scanning analysis ratio of PDCD4 to GAPDH. Quantification data represents mean ± s.e.m, n=3. (B) PCNs were treated with 4mg/ml ETOH for different time points as indicated. Western analysis for PDCD4 and GAPDH was performed. Lower panel indicate the relative intensity of PDCD4 normalized to GAPDH (mean ± s.e.m, n=3). (C) 5 DIV PCNs were treated with ETOH (4mg/ml) for 24 h and the culture media containing ETOH were replaced with normal culture media for additional 12 h and 24 h. Equal amount of lysates were analyzed for PDCD4 and GAPDH protein expression. One way ANOVA was performed to establish statistical significance. In A, B * - P<0.05, when compared with untreated controls; ns-not significant compared with untreated control.

