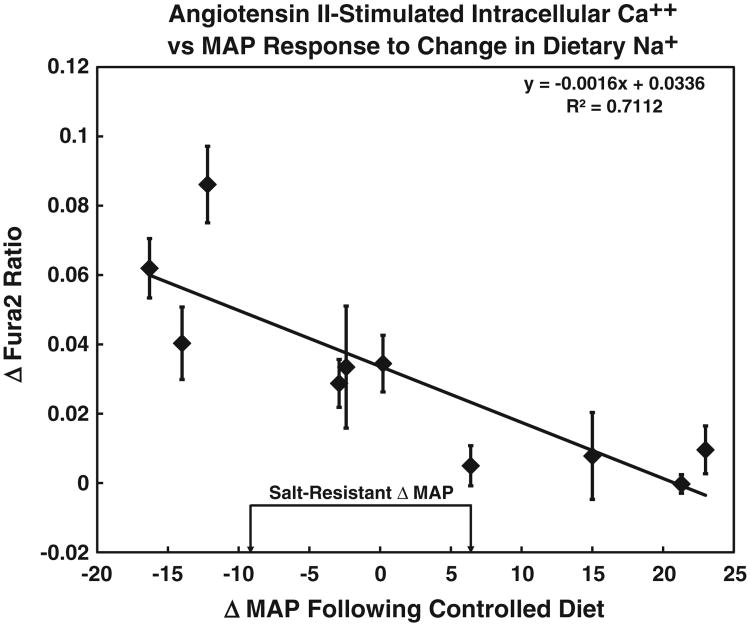
Fig. 4.
Cells were stimulated with angiotensin II (10 nmol/l) to increase intracellular Ca++ that was then measured using Fura-2 fluorescence. The SS index of each individual subject is depicted on the X axis expressed as the change (Δ) in mean arterial pressure (MAP) vs. Fura-2 ratio (representing intracellular Ca++), similar to Fig. 3. There was a negative correlation between the SS index and intracellular Ca++ stimulation by angiotensin II (y = −0.0016x + 0.0336, R2 = 0.7112, P < 0.001, N = 10). The data are shown as mean ± SE of the mean from 5 to 40 replicate measurements from each specimen.

