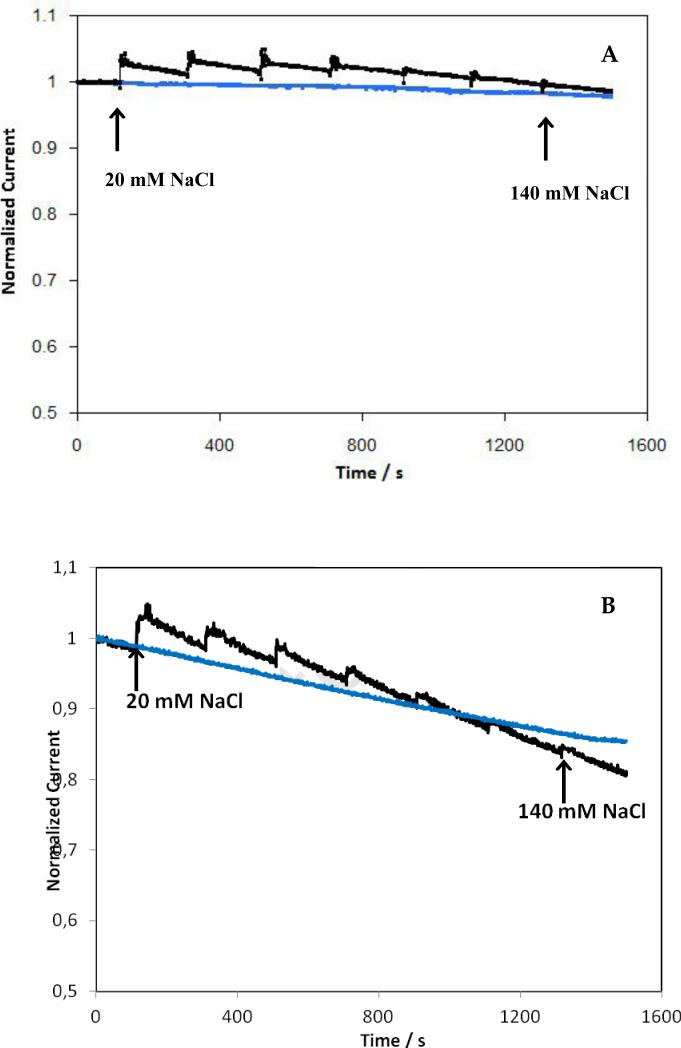
Figure 6.
Dependence of current density on time for electrodes modified with BOD from B. pumilus (A) or T. tsunodae (B) in absence (blue curves) or presence of successive additions of Na Cl (black curves). The arrows indicate the total concentration of NaCl in the cell. Electrodes modified as in Figure 4. 100mM phosphate buffer pH7.2, under O2, 37°C, 500rpm, measured at +0.1V vs Ag/AgCl.

