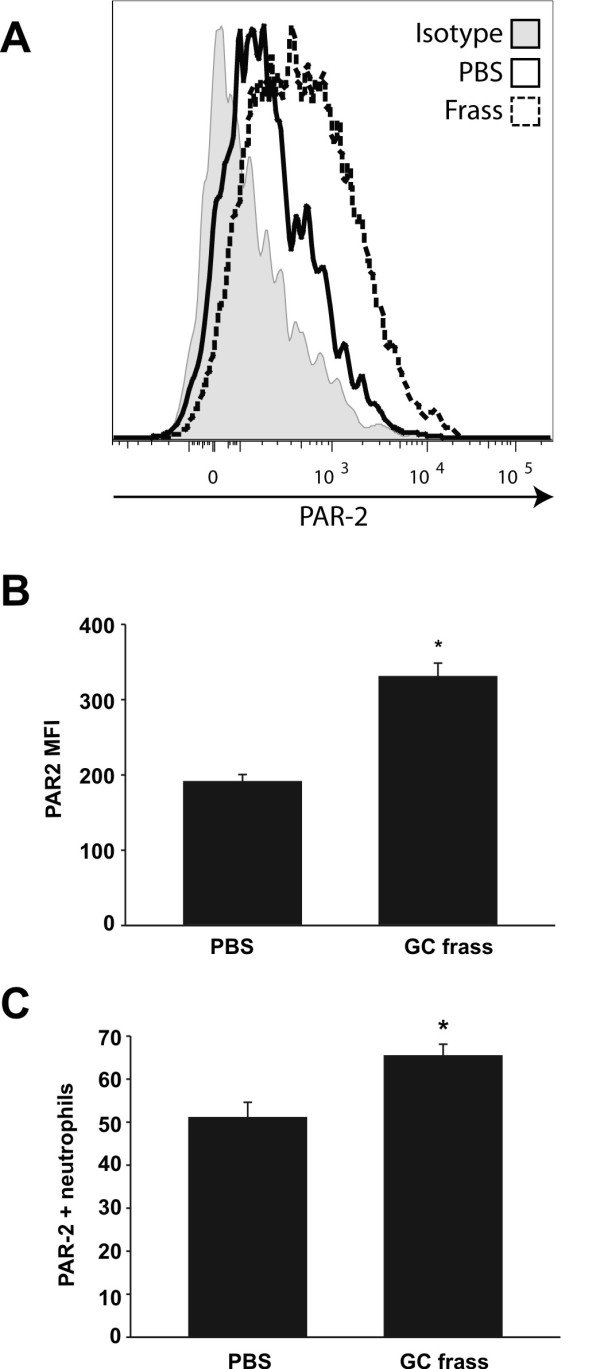
Figure 2.

GC frass increased PAR-2 expression on pulmonary neutrophils. Lungs from PBS or GC frass-treated mice were harvested 20 h post exposure and stained for flow cytometric analysis of PAR-2 expression. A. Representative histogram showing PAR-2 expression on gated pulmonary neutrophils from PBS-treated (solid line) or GC frass-treated (broken line) mice. Solid grey histogram depicts staining with isotype control antibody. B. Average PAR-2 MFI. C. Percentage of PAR-2-positive neutrophils. In both cases (B + C), data are expressed as mean ± SEM (n = 8 mice per group) and statistical significance was determined by Student’s t-test (*p < 0.001).
