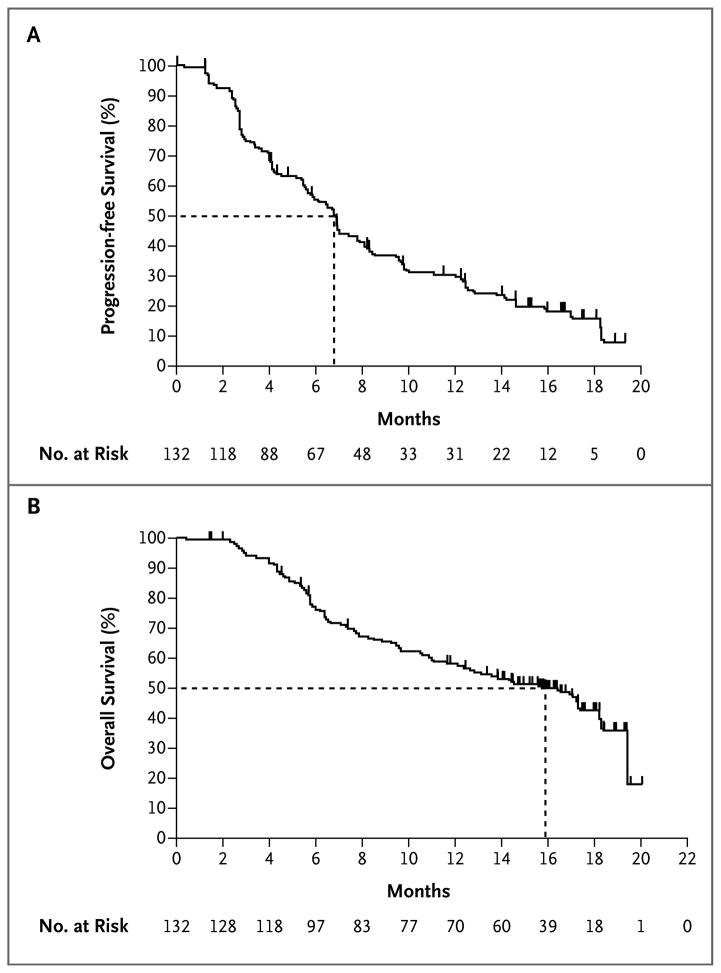
Figure 3. Kaplan–Meier Estimates of Progression-free and Overall Survival.
Shown is the percentage of vemurafenib-treated patients with progression-free survival (Panel A) and overall survival (Panel B). The dashed lines indicate the medians. Tick marks along the curves represent the date of the last tumor assessment before the time of data cutoff among patients with censored data without disease progression or death.

