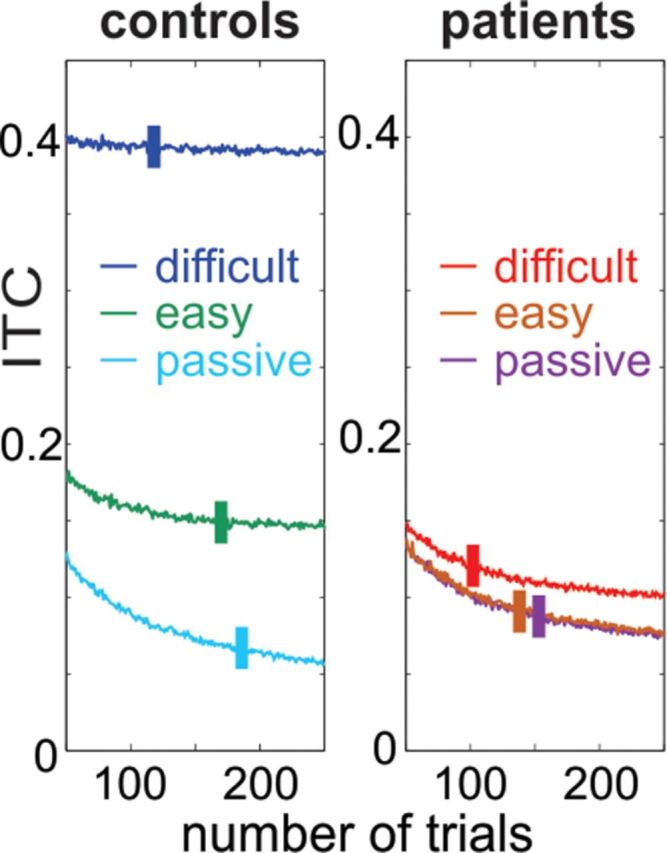
Figure 1.

Trial number-related bias in ITC. Traces show averaged ITC values related to 1000 random draws of 50–250 phase values, which were measured at 0.67 Hz at stimulus onset, and were pooled across all controls and patients in the three different task conditions. Lines across the ITC traces mark the average number of trials in each condition. Note that even though ITC values change as a function of the number of trials, the differences among conditions are persistent.
