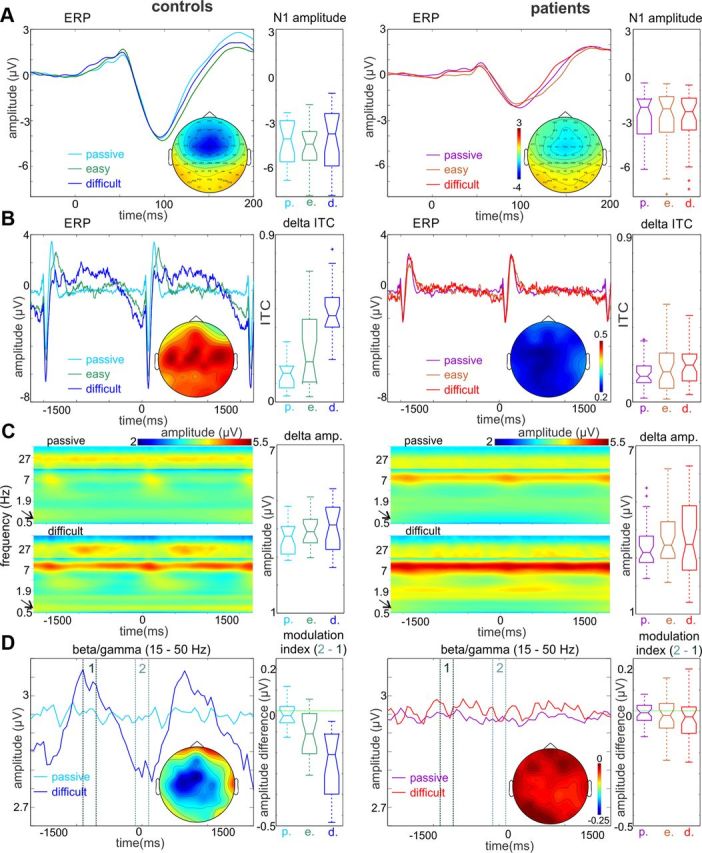
Figure 2.

Task-dependent entrainment of low-frequency neuronal oscillations and their relationship to high-frequency neuronal activity. A, Surface auditory ERP waveforms from frontocentral electrode location FCz in response to standard tones in controls and patients. The EEG data were filtered in the 3–55 Hz frequency band to eliminate the low-frequency baseline fluctuation apparent in the waveforms displayed. Boxplots show that the amplitude of the N1 peak is the same across conditions within subject groups and significantly smaller in patients versus controls. Repeated-measures ANOVA revealed a highly significant main effect of group (F(1,58) = 18.4, p < 0.0001). Color map insets demonstrate the averaged topographical distribution of the N1 component over the scalp. B, Same surface ERP waveforms from frontocentral electrode FCz as in A, but data were not filtered, and ERPs are displayed on a longer time scale. In controls (n = 20), an oscillatory baseline fluctuation appears during the easy frequency discrimination task (green trace), which becomes more prominent during the performance of the more difficult frequency discrimination (dark blue trace). As opposed to this, a baseline fluctuation is just noticeable in patients (n = 40) and does not show the same task dependence. Boxplots to the left display delta (0.67 Hz) ITC at stimulus onset in passive and attentive conditions. It is apparent that the delta ITC of patients does not show any significant task-related changes. Map insets demonstrate the distribution of delta ITC across the scalp during the performance of the difficult task. C, Averaged time–frequency maps of single-trial neuroelectric activity in passive and individualized attention conditions. The amplitude of activity >13 Hz was multiplied by 1.3 for better visibility. As the boxplots to the right show as well, narrow-band delta (0.6–0.8 Hz, marked by the arrows) amplitude does not change significantly across conditions. Nonetheless, there is a significant attention-related amplitude increase in the alpha band in both controls and patients. Also note that in controls but not patients oscillations in the beta/gamma bands exhibit task structure-related amplitude fluctuations. D, Averaged (15–50 Hz) beta/gamma amplitude waveforms reveal that while there is no stimulus structure-related gamma amplitude modulation in the passive condition, gamma amplitude fluctuates rhythmically in the active condition in controls. While the overall level of gamma oscillatory activity is the same in patients, they lack gamma amplitude modulation. Boxplots to the right display the pooled difference of peristimulus (−100 to 100 ms, designated by “2”) and interstimulus (−900 to −700 ms, designated by “1”) gamma amplitudes to quantify this observation. Map insets illustrate the scalp distribution of the beta/gamma modulation index during the performance of the difficult task.
