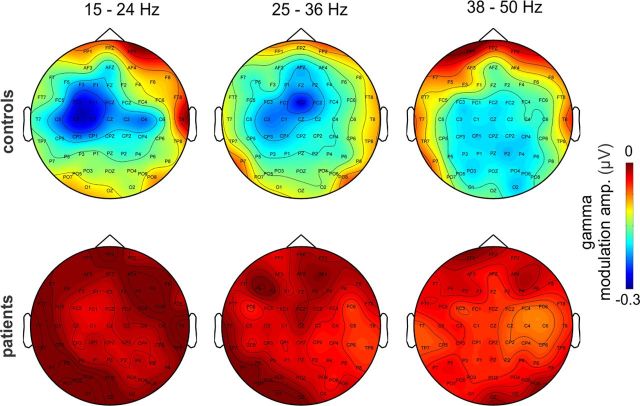
Figure 3.
Topographic distribution of task-related beta/gamma amplitude modulation. The scalp distribution maps of beta/gamma modulation amplitudes in three sub-bands show that the location of maximal task structure-related modulation is characteristically different in control subjects (top). Patients show substantially lower amplitude modulation in all sub-bands, with somewhat different scalp topographies.

