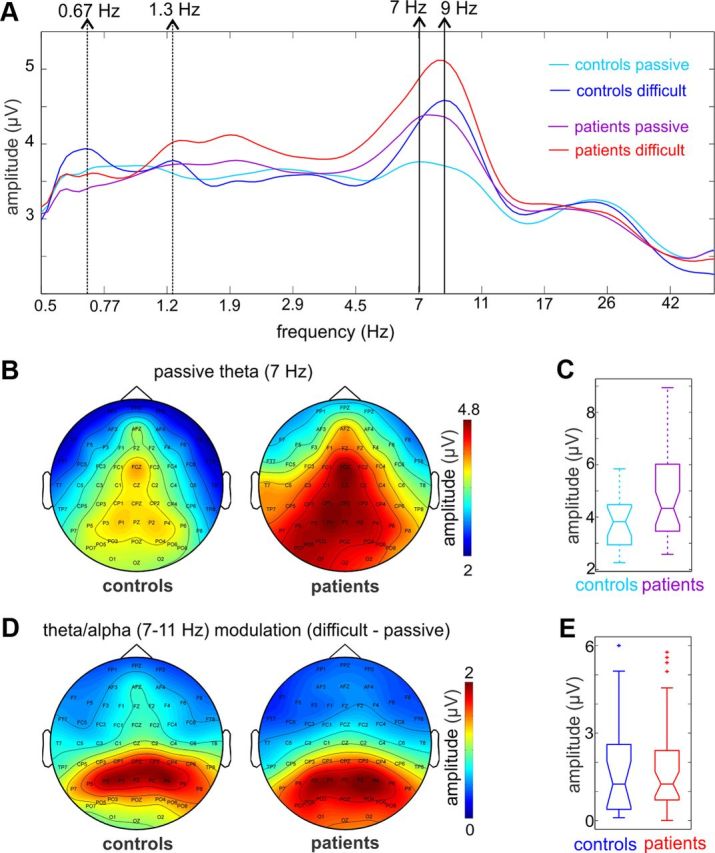
Figure 5.

Theta and alpha band neuronal activity in controls and patients. A, Spectrogram of neuronal activity recorded at frontocentral electrode FCz, measured in single trials in the −1000 to −200 ms prestimulus time interval. Light and dark blue traces are averaged spectrograms of controls in passive and individualized attention conditions respectively, while purple and red traces are averaged spectrograms from the same conditions in patients. Dotted arrows to the left mark the frequency that corresponds to the stimulation rate and its first harmonic. During the performance of the auditory task, both subject groups show somewhat increased delta amplitude at these frequencies. Nonetheless, this amplitude increase is not significant, when measured either around the peak or in the entire delta band (see Results). The prominent attention-related changes in the spectrum occur in the theta/alpha bands. As the spectrograms illustrate, the 7 Hz peak in the passive condition “shifts” to 9 Hz in the attentive condition in both groups, due to an amplitude increase of neuronal activity in the alpha band. B, Topographic maps of neuronal activity at the 7 Hz theta peak in the passive condition in controls and patients indicate that at least part of the measured theta activity most likely originates in auditory cortical regions. It is also apparent that the amplitude of theta frequency band neuronal activity is larger in patients. C, Comparing the amplitude of theta (7 Hz) oscillatory activity in the passive condition in controls versus patients at FCz revealed a just significant difference (Wilcoxon rank sum, p = 0.046). D, As opposed to the distribution of theta band activity in the passive condition, the attention-related amplitude increase in the theta/alpha bands (7–11 Hz) apparent in the spectrograms (see A) maps mostly to parietal and parieto-occipital regions. E, Boxplots of pooled alpha amplitude increase over parietal electrodes (averaged across PZ, P1, P2, P3, and P4) show that it does not differ in the two subject groups (Wilcoxon rank sum test, p > 0.01).
