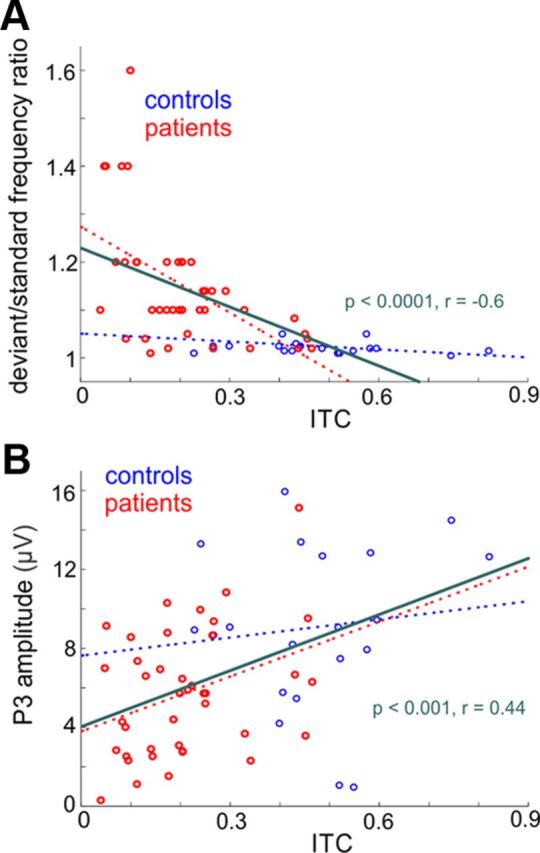
Figure 7.

Correlation of delta ITC with pitch discrimination ability and P3 in control subjects and schizophrenia patients. A, Linear regression plot of delta ITC at stimulus onset versus tone discrimination ability in controls and patients. Pearson's linear correlation coefficients and the significance of correlations are displayed in green. The linear regression of control and patient data are displayed by dotted lines (controls: r = −0.30, p = 0.08; patients: r = −0.55, p = 0.001). B, Similar to above, delta ITC was derived from analysis of responses to standard stimuli that followed or preceded the deviants by at least two stimulus positions (see Materials and Methods). P3 amplitudes were extracted from responses to deviant stimuli using previously described methods (Leitman et al., 2010). Delta ITC correlated significantly with P3 amplitude both across groups and in patients alone. The linear fit of control and patient data are displayed by dotted lines (controls: r = 0.11 p = 0.63; patients: r = 0.35, p = 0.036).
