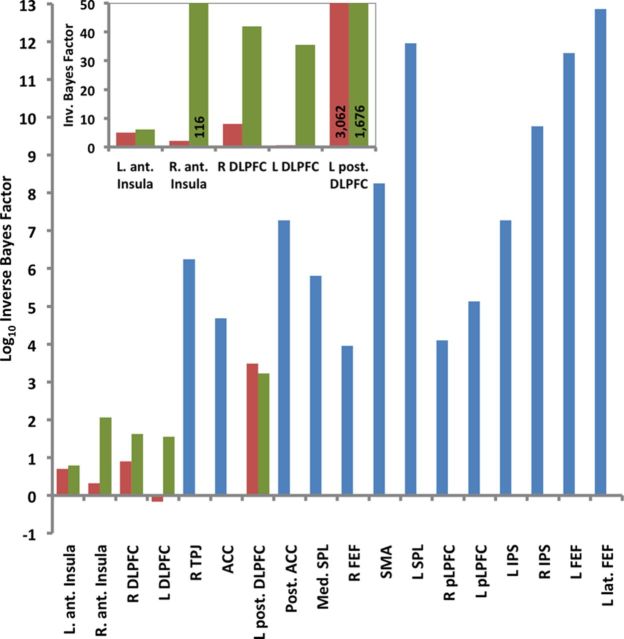
Figure 8.
Bayesian analysis of modality coding pooled across Experiments 1–4 and process coding in Experiment 5. Main plot, The log (base 10) transformed inverted Bayes factor (i.e., larger numbers represent evidence for classification) is plotted for each brain region. Red bars represent Experiments 1–4 meta-analysis for brain regions that appear to be insensitive to modality, based upon examination of MVPA time courses in Experiments 1–4 and the ANOVA in Experiment 4. Blue bars represent Experiments 1–4, remaining brain regions. Green bars represent Experiment 5 (process). Inset, Inverted Bayes factors are plotted (without the log transform) for putative modality-independent regions. Colors are as in main plot. Numbers overlaid on bars denote values exceeding the scale of the plot.

