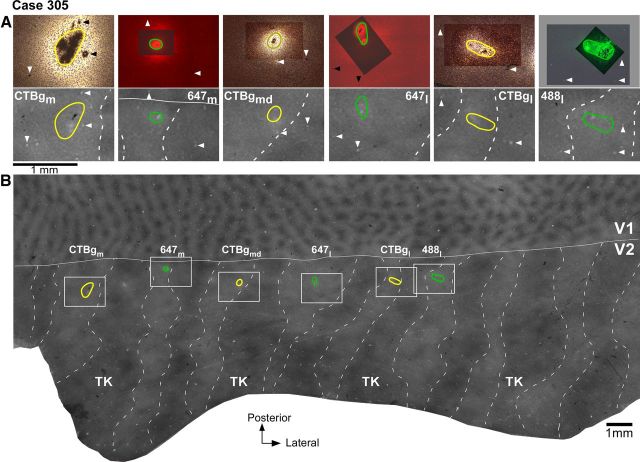
Figure 2.
Tracer injections in V2 pale stripes (case 305). A, Top, High-power images of the tracer injection sites within the field of views boxed in B. The CTB-alexas injection sites are viewed under fluorescent microscopy, while the CTBg injection sites are viewed under dark-field microscopy. The images show the extent of the injections through the V2 cortical layers and were obtained by merging several images of sections taken at different cortical depths to demonstrate the full extent of the injection sites. To show both the injection core and the blood vessel profiles used for referencing with CO-stained sections, the latter were photographed using a longer exposure time than the former, and the two photographs were aligned in Adobe Photoshop. In the overexposed image (the one at the bottom of the stack), tracer transport around the injection core can appear as a bright glow partly hidden by the darker image of the uptake zone laying above. Note that this glow is not part of the tracer uptake zone but it is local tracer transport, as labeled cells could be discerned in this region. The tracer uptake zones are outlined in green for the injections laying in pale lateral stripes, and in yellow for the injections laying in pale medial stripes. Injection cases and tracer types are indicated in the bottom panels and correspond to those shown in B above each injection outline. Arrowheads point at the same blood vessel profiles as the arrowheads in each respective bottom panel. Bottom, Each panel shows a higher-power view of CO staining within its respective boxed region in B, with the outline of the tracer injection from the top panel superimposed. Each pair of top and bottom panels shows the same field of view in different tissue sections. B, Low-power and wide field of view of a composite CO image of unfolded and flattened V1 and V2, obtained by aligning and merging images of three tissue sections stained for CO. The image reveals V1 blob and interblob compartments in V1 and stripes (dashed contours) in V2. TK, Thick stripes; solid white contour, V1/V2 border; green and yellow ovals, outlines of tracer injection sites in pale lateral and pale medial stripes, respectively taken from the top panels in A. The regions within the white boxes are shown at higher power in the bottom panels of A. Same conventions are used in subsequent figures.

