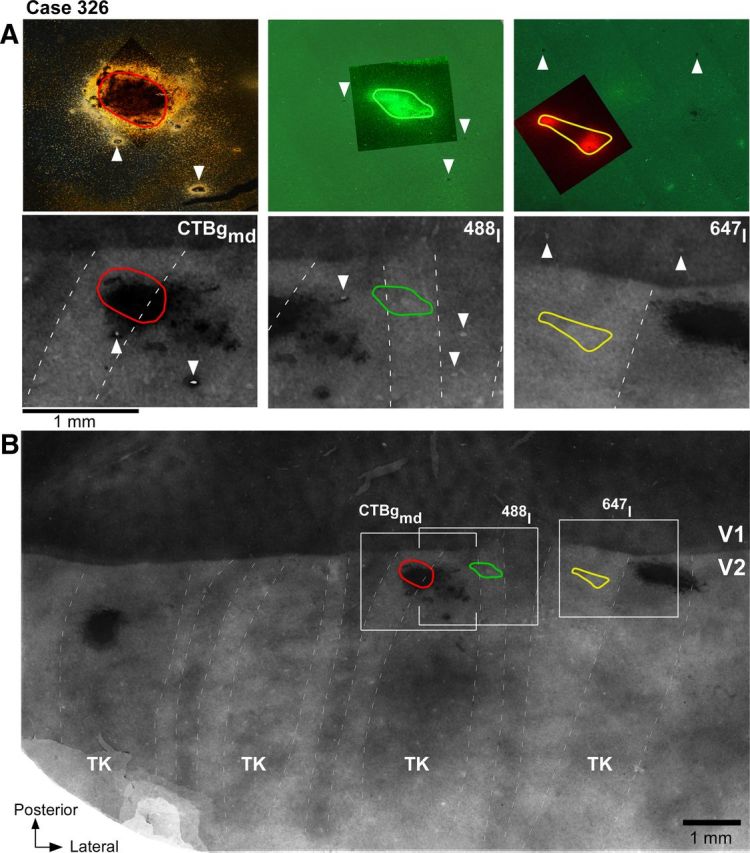
Figure 5.

Paired tracer injections in consecutive pale stripe types (case 326). A, Top, High-power images of the three tracer injection sites within the field of views boxed in B. The CTB488 and CTB647 injection sites are viewed under fluorescent microscopy, while the CTBg injection is viewed under dark field. The images show the full extent of the injections through the cortical layers and were generated by merging images of sections at two cortical depths (from the most superficial and deepest sections that contained the injection site). The CTB647 injection appears as two separate injection sites, because we only show the uppermost and lowermost sections containing the injection, but the sections in between them also contained an injection site. Bottom, Each panel shows a higher-power view of CO staining within its respective boxed region in B, with superimposed the outline of the tracer injection from the top panel. B, Low-power and wide field of view of a composite CO image of unfolded and flattened V1 and V2 obtained by aligning and merging images of five tissue sections stained for CO. Other conventions are as in Figure 2.
