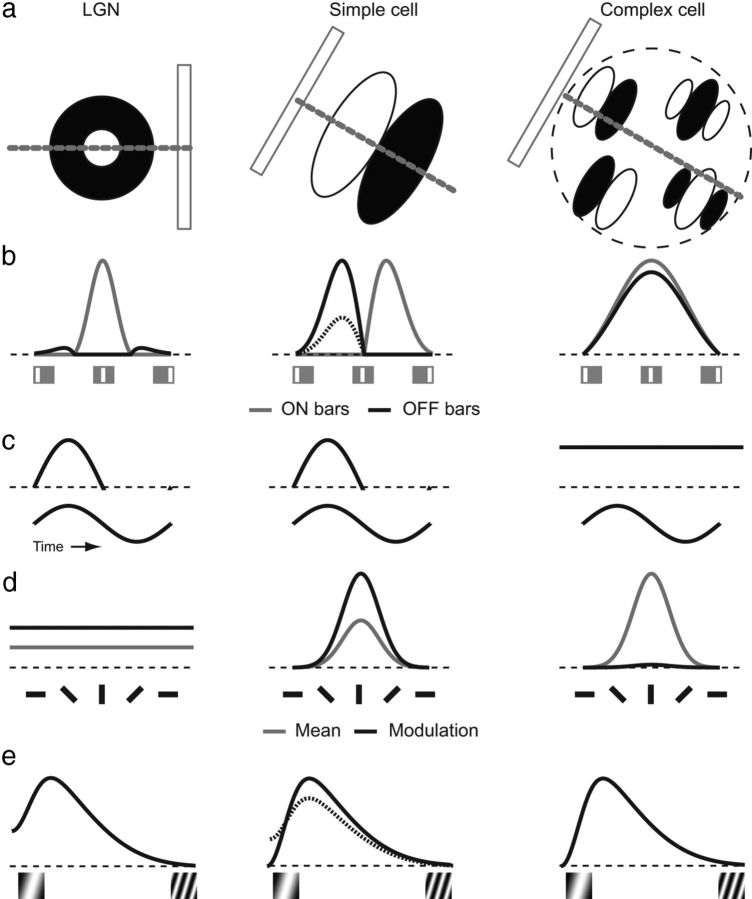
Figure 1.
Predicted responses of “classical” cat LGN, simple, and complex cells to the stimuli used in this study. a, Schematic of a thin bar moving across the RF of LGN, simple, and complex cells. LGN and simple cells receive ON and OFF drive at distinct locations in the visual field; complex cells respond to a properly oriented bar at any location within the receptive field, as indicated by the multiple “simple” subunits shown (Hubel and Wiesel, 1959, 1961, 1962; Movshon et al., 1978b). b, Responses of each cell to thin ON and OFF bars at distinct locations. LGN cells are dominated by a single sign (ON in this example), whereas simple cells exhibit segregated subunits that may be balanced (thick lines) or not balanced (dotted OFF line), and complex cells exhibit overlapping ON and OFF responses. c, Responses to sinusoidal grating stimulation at the orientation that gives maximum response. LGN and simple cells exhibit modulated responses, while complex cells exhibit more constant responses. d, Responses to gratings at different orientations (gray line, mean response, F0; black line, magnitude of response modulation, F1). LGN cells are primarily indifferent to orientation, whereas simple and complex cells are orientation selective. e, Spatial frequency selectivity. LGN cells respond maximally at a preferred spatial frequency, but also respond to very low spatial frequencies; that is, they are low-pass cells. Simple cells are often bandpass and do not respond to low spatial frequencies, although they can be low pass if the ON and OFF subunits are not balanced (dotted line). Complex cells commonly exhibit bandpass responses.

