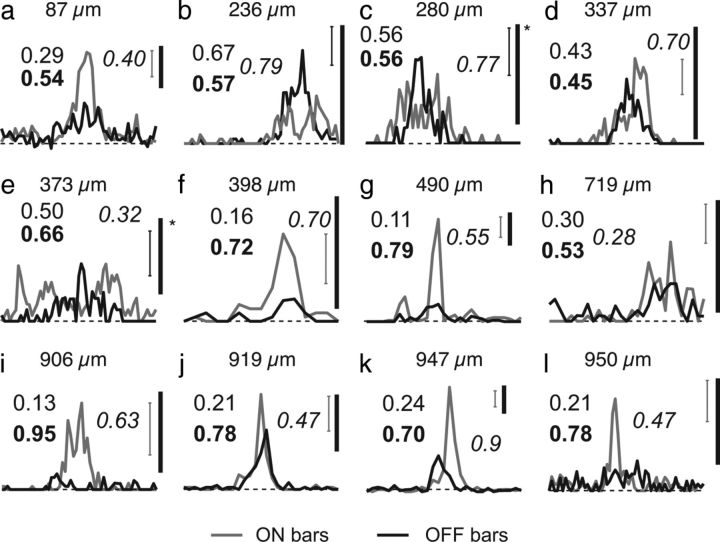
Figure 6.
a–l, One-dimensional receptive field profiles for example layer 2/3 cells that exhibit high modulation (modulation index, ≥0.99). Scale bars: no asterisk, 10 Hz; asterisk, 5 Hz. Error bars indicate the SE of the mean at the position with the largest response. Plain numbers indicate ON/OFF index values; bold numbers indicate the ON/OFF segregation index; italics indicate orientation selectivity index values (1 − CV). Layer 2/3 cells with high modulation and orientation selectivity exhibit a variety of profiles, including profiles dominated by single signs (f, g, i, l), profiles that reflect unbalanced ON/OFF drive (a, j, k), and relatively balanced and segregated ON/OFF input (b–e).

