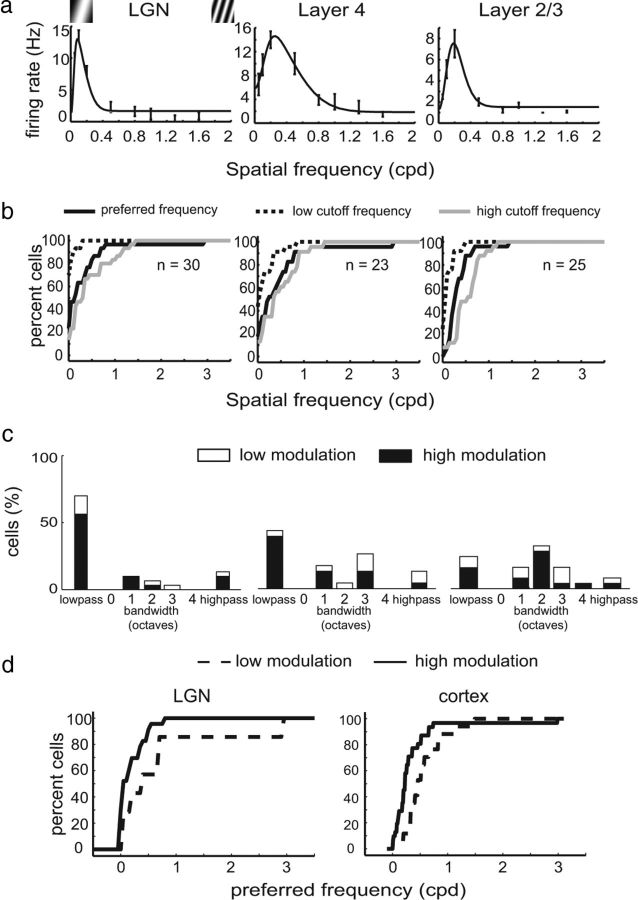
Figure 7.
Spatial frequency selectivity in tree shrew LGN/V1. a, Responses of a typical LGN cell (left), cortical layer 4 cell (middle), and cortical layer 2/3 cell (right). b, Cumulative distributions of low cutoff, preferred spatial frequency, and high spatial frequency for LGN cells (left), layer 4 cells (middle), and layer 2/3 cells (right). c, Histograms of spatial frequency bandwidth for the same cell groups; a majority of LGN and layer 4 cells exhibit low-pass spatial frequency tuning, whereas a majority of layer 2/3 cells exhibit bandpass tuning. d, Preferred spatial frequency tuning for cells with low (<1) and high (>1) modulation index values. Cells that exhibited low modulation index values also tended to exhibit higher preferred spatial frequencies.

