
Figure 2.
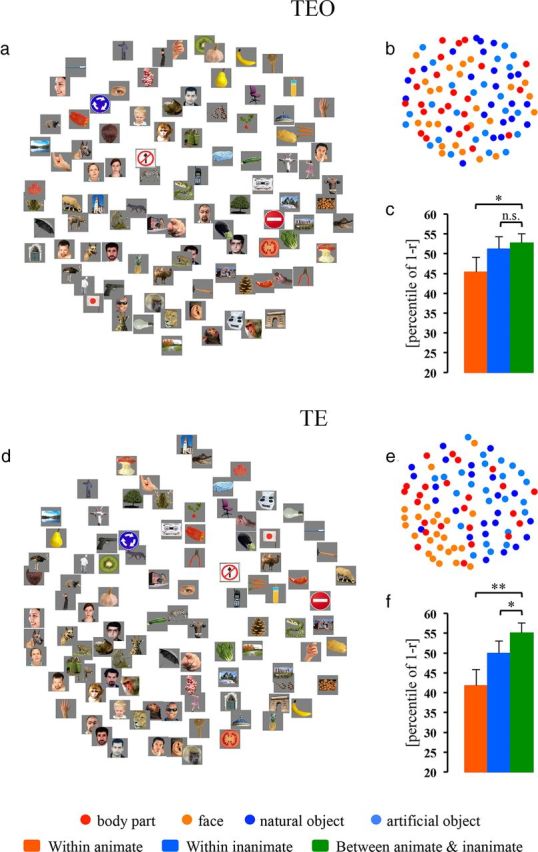
MDS arrangements and cluster effects (animate and inanimate) in areas TEO and TE. MDS results in TEO and TE are shown as arrangements of the experimental exemplars (a and d) or icons denoting the experimental conditions (b and e). The experimental exemplars/icons have been arranged such that their pairwise distances approximately reflect their response-pattern dissimilarities (multidimensional scaling, dissimilarity: 1 − Pearson r, criterion: metric stress). In each arrangement, exemplars/icons placed close together elicit similar response patterns, whereas exemplars/icons placed far apart elicit dissimilar response patterns. The arrangement is unsupervised and does not presuppose any categorical structure. The bar graphs next to the MDS arrangements show the animate and inanimate cluster effects in TEO (c) and TE (f): the mean dissimilarities (percentile of 1 − Pearson r) for within-animate pairs (red bar), within-inanimate pairs (blue bar), and between-animate-and-inanimate pairs (green bar). Error bars indicate the SD of the mean dissimilarity estimated by bootstrap resampling of the stimulus set. We defined the CCE as the difference (in percentile points) between the mean dissimilarity for within-category pairs (e.g., two animate exemplars or two inanimate exemplars) relative to the mean dissimilarity for between-category pairs (e.g., one animate exemplar and one inanimate exemplar). The significance of the CCEs is given above the bars in each panel (*p < 0.05, **p < 0.01; n.s., not significant). The p value is from a bootstrap test.