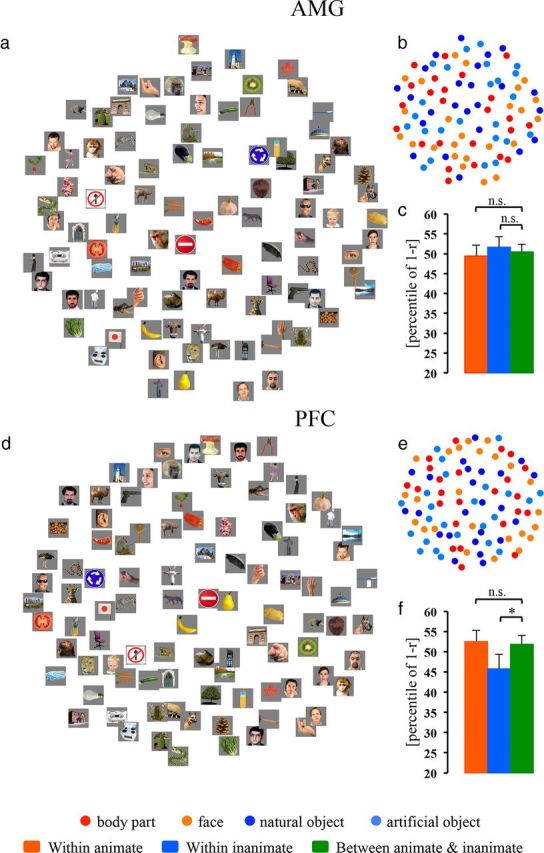
Figure 7.

MDS arrangements and cluster effects (animate and inanimate) in the AMG and PFC. The MDS results for the AMG and PFC are shown as arrangements of the experimental exemplars (a and d, respectively) or icons denoting the experimental conditions (b and e, respectively). The bar graphs next to MDS arrangements show the animate and inanimate cluster effects in the AMG and PFC (c and f, respectively). The significance of the CCEs is given above the bars in each panel (*p < 0.05; n.s., not significant). The p value is from a bootstrap test. For all other notations, see Figure 2.
