
Figure 8.
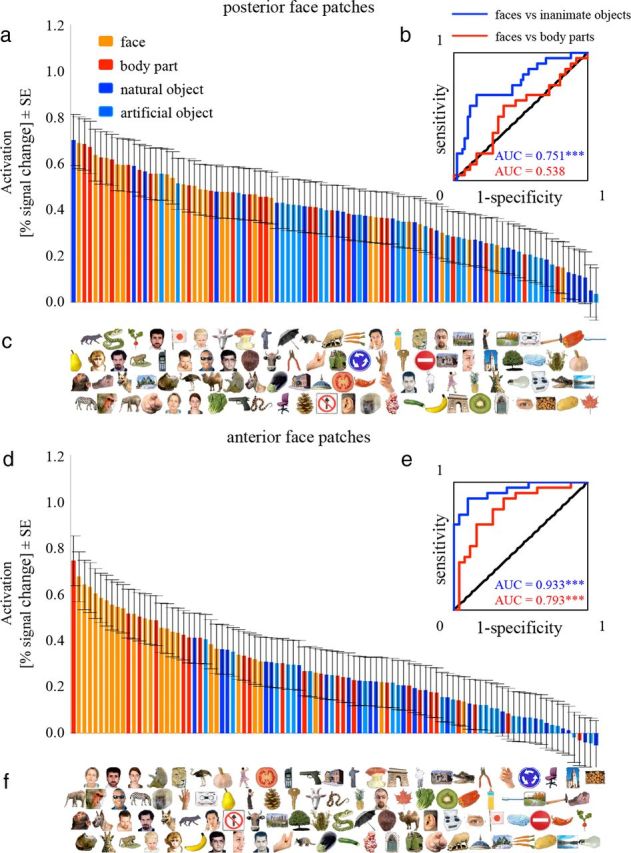
The ranked averaged single-exemplar activations elicited by the 96 exemplars in the IT face patches. a, d, Each bar represents the regionally averaged activation to one of the 96 exemplars in percentage signal change, averaged across subjects in the posterior (a) and the anterior (d) face patches. c, f, Each exemplar is placed exactly below the bar that reflects its activation, so that the exemplars are ordered from left to right. The bars are color-coded for categories to give an overall impression of face-selectivity without having to inspect each individual exemplar. b, e, ROC curves indicate performance for discriminating faces from body parts (red) or from inanimate objects (blue). Inserted values indicate the AUC using the same color code. The AUC of 1 or 0 indicates that the response distributions for the two categories are completely dissociable. A value of 0.5 (diagonal line) indicates that the response distributions for the two categories are overlapping and the capacity to assign a given response to the correct category is at chance (50%). ***p < 0.001. The p value is from a one-tailed randomization test.