
Figure 9.
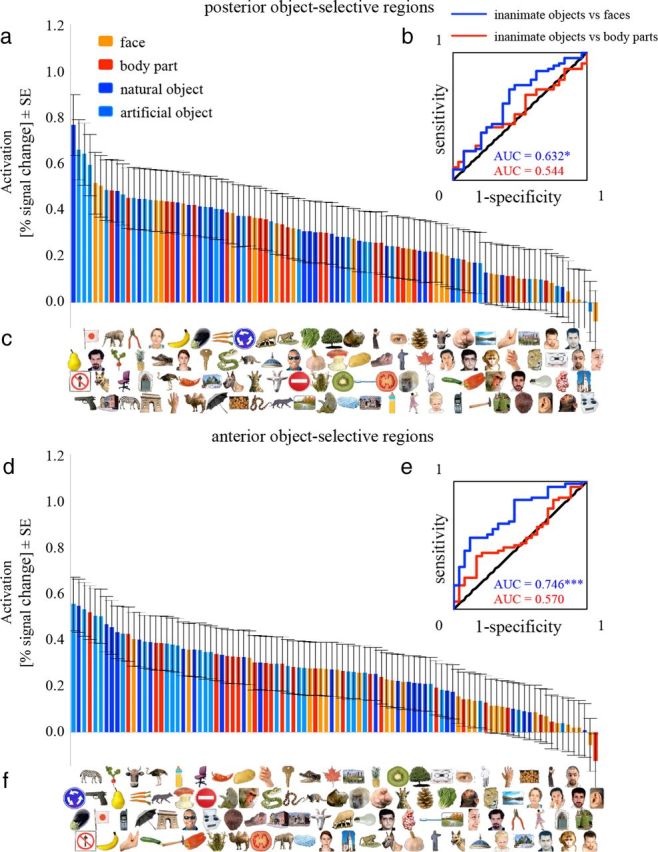
The ranked averaged single-exemplar activations elicited by the 96 exemplars in the IT object-selective regions. a, d, Each bar represents the regionally averaged activation to one of the 96 object exemplars in percentage signal change, averaged across subjects in the posterior (a) and the anterior (d) object-selective regions. c, f, Each exemplar is placed exactly below the bar that reflects its activation. b, e, ROC curves indicate performance for discriminating inanimate objects from faces (blue) or from body parts (red). *p < 0.05, ***p < 0.001. The p value is from a one-tailed randomization test. For all other notations, see Figure 8.