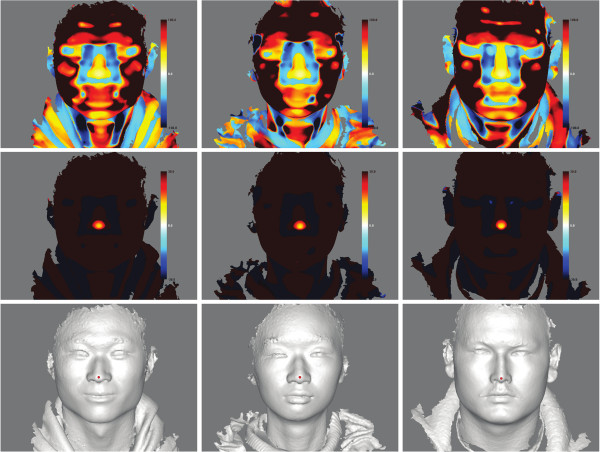
Figure 3.
Nose tip localization using RID illustrated for three individuals. a Han Chinese female in the left column, a Han Chinese male in the middle column and an Uyghur female in the right column. Top row, the f values are shown as color gradients. Warm colors indicate convex sphere fitting, while the cold colors indicate concave to the reader. The f values deviating more from 0 are marked with greater color intensity. Central row, the minimum convex f values plotted for different individuals, which can be seen to coincide with the manually annotated nose tips shown in the bottom row.

