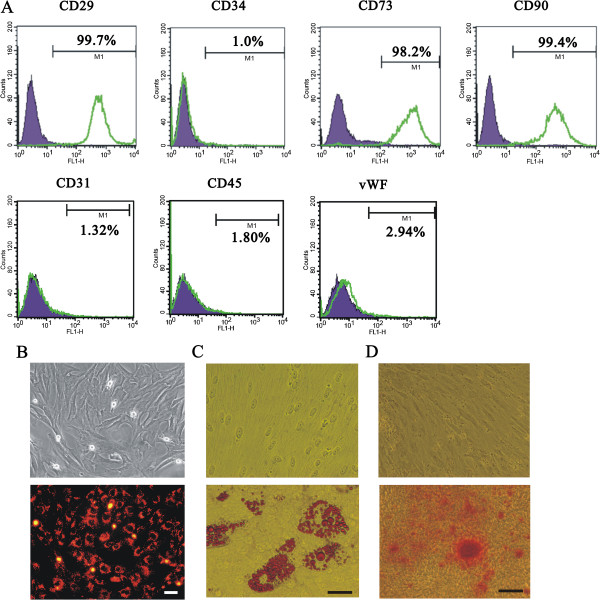
Figure 1.
Identification of rat ASCs. (A) The 4th passage of rat ASCs was analyzed with flow cytometry for the expression of CD29, CD31, CD34, CD45, CD73, CD90 and vWF biomarkers. Green lines represent the specific fluorescent antibodies, and black lines represent isotype controls. (B) The 4th passage of rat ASCs was labeled with CM-DiI and observed under a fluorescence microscope. Bar: 50 μm. ASCs were assessed for adipogenic and osteogenic differentiation, and the cells were stained with Oil red O (C) and Alizarin red S (D), respectively. Scale bar, 200 μm.

