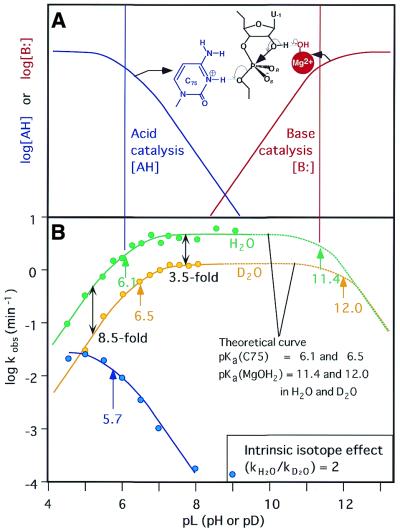
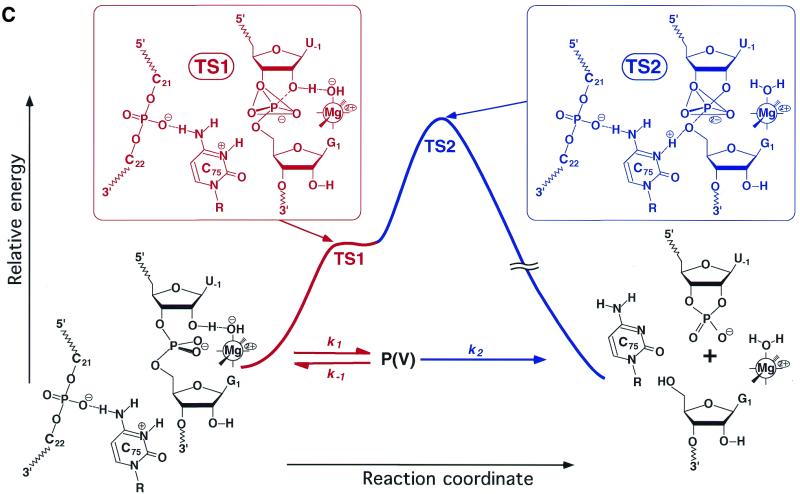
Figure 9.
Reactions catalyzed by the genomic HDV ribozyme. (A) Fractions of the active species [AH] that acts as an acid catalyst (blue) and the active species [B:] that acts as a base catalyst (red), respectively. The pKa of the acid catalyst is 6.1 and that of the base catalyst is 11.4 in H2O. The theoretical curve for H2O in (B) was produced by the multiplication of these two curves. (B) Dependence on pH of the deuterium isotope effect in the HDV ribozyme-catalyzed reaction. Green circles, rate constants in H2O; yellow circles, rate constants in D2O; solid curves, experimental data; dotted curves, theoretical data calculated using the equation in Figure 6 and pKa values for C75 and for hydrated Mg2+ ions of 6.1 and 11.4 in H2O and 6.5 and 12.0 in D2O, respectively, assuming α = 2. The blue curve is a pH profile in 1 M NaC1 and 1 mM EDTA in the absence of divalent metal ions. (C) Energy diagram for cleavage of its substrate by an HDV ribozyme. The rate-limiting step in the reaction with the natural substrate is the cleavage of the P-(5′-O) bond. The structures of transition states TS1 and TS2 are also shown. P(V), the pentacoordinate intermediate/transition state.


