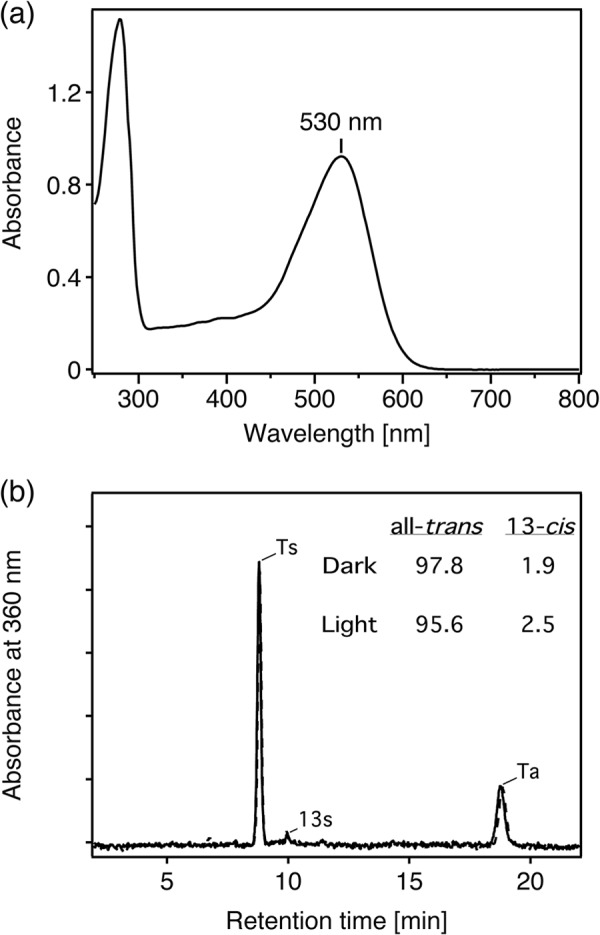
FIGURE 4.

Absorption spectrum and retinal composition of TR. a, shown is an absorption spectrum of purified TR in buffer containing 1 m NaCl, 0.05% DDM, and 50 mm Tris-HCl, pH 7.0. The spectrum was recorded at room temperature (∼25 °C). b, shown are normal-phase HPLC chromatograms of retinal isomer extracted from TR in 1 m NaCl, 0.05% DDM, and 50 mm Tris-HCl, pH 7.0, in the dark (solid line) and after illumination with >500-nm light for 10 min (dotted line). Eluting retinal was detected at 360 nm. The molar composition of retinal isomers was calculated from the peak areas. Ts, Ta, and 13s denote retinal with all-trans/15-syn and all-trans/15-anti- and 13-cis/15-syn configurations, respectively. The molar ratios (%) of retinal isomers under dark and light conditions are indicated.
