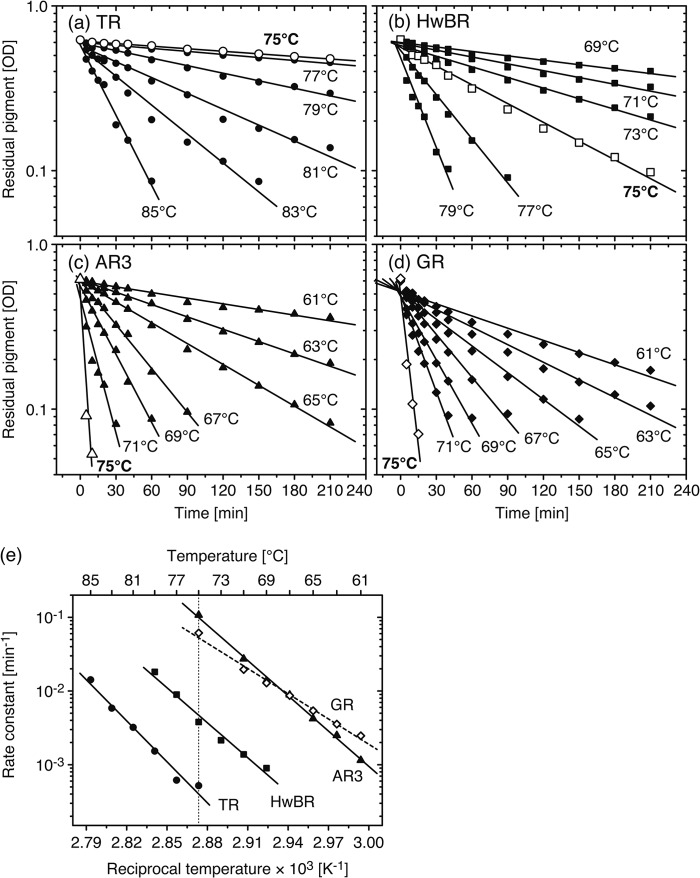
FIGURE 9.
Thermal stability of TR and the other rhodopsins. Denaturation kinetics of TR (circles, a), HwBR (squares, b), AR3 (triangles, c), and GR (diamonds, d) at various temperatures are shown. The data for open symbols of each sample are those at 75 °C. The sample conditions were the same as described for Fig. 8. The data were analyzed with a single exponential function (Equation 4) to calculate denaturation rate constants. e, shown are Arrhenius plots for the thermal denaturation of TR, HwBR, AR3, and GR. The fitting curve for GR is shown as a broken line. The data were analyzed by Equation 2 and Equation 3 to estimate the activation energy, Ea.

