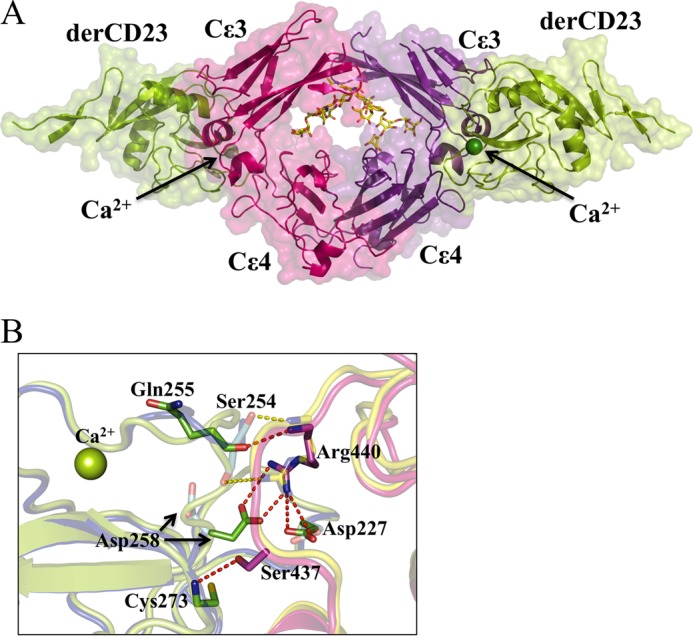
FIGURE 6.

Structure of the Ca2+-bound derCD23-Fcϵ3-4 complex. A, two molecules of derCD23 (green, Cα traces with surfaces) bind one to each heavy chain of Fcϵ3-4 (pink and purple). The carbohydrate (red, blue, and yellow, in all-atom representation) and Ca2+ ions (green spheres) are also shown. B, enlarged view of a region of the Ca2+-bound and Ca2+-free derCD23-Fcϵ3-4 interfaces. In the presence or absence of Ca2+, the majority of interactions at the interface remain the same, only the differences are highlighted as follows: six hydrogen bonds (red dashes) are observed only in the Ca2+-bound form of the complex (Fcϵ3-4 in pink, derCD23 in green); two hydrogen bonds (yellow dashes) are seen only in the Ca2+-free form of the complex (Fcϵ3-4 in blue, derCD23 in yellow). Thus there is a net gain of four hydrogen bonds, mainly associated with the two new salt bridges between derCD23 and Fcϵ3-4 (Asp-227 to Arg-440 and Asp-258 to Arg-440) upon Ca2+ binding.
