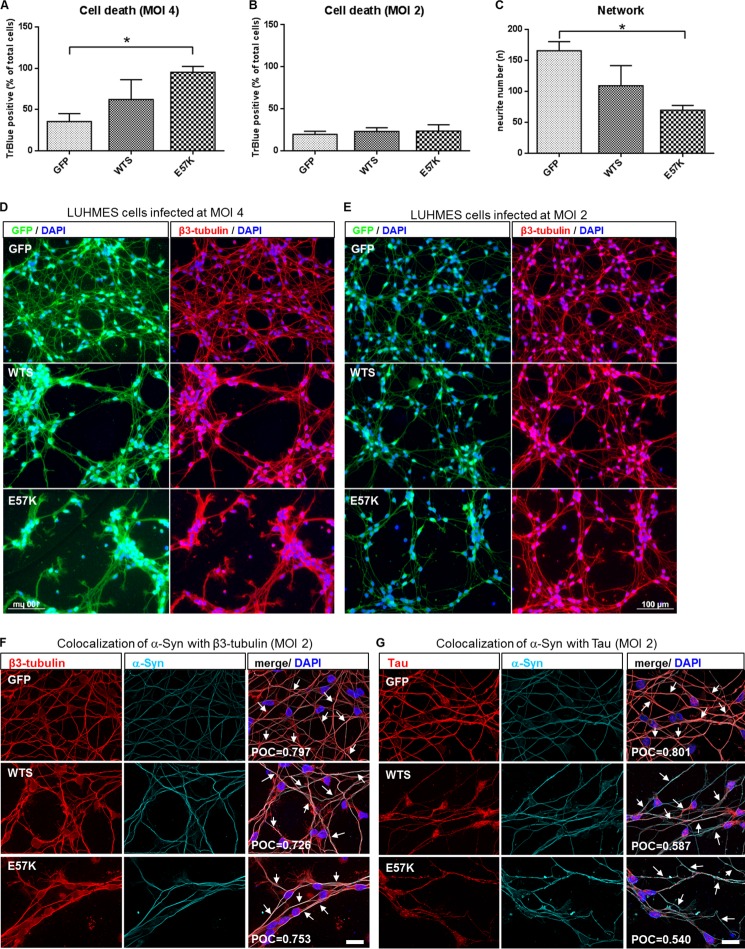
FIGURE 5.
Mild overexpression of E57K in a dopaminergic human neuronal cell line leads to impaired neurite morphology. A and B, cell survival rates of LUHMES cells infected with lentiviruses expressing either GFP or α-Syn (WTS or E57K) at MOI 4 and MOI 2, respectively. High overexpression of WTS and E57K (MOI 4) (A) causes cell toxicity in neuronal cells. Mild levels of α-Syn overexpression (MOI 2) (B) do not significantly increase cell death. Cell death was determined at day 6 of differentiation as a percentage of trypan blue-positive cells within the total number of cells. Mean ± S.D. (error bars) of three independent experiments is shown. *, p < 0.05. C, quantification of the neurite network of LUHMES cells infected at MOI 2. E57K significantly disrupt neuronal network morphology. Neurite numbers were calculated as numbers of neurite crossing points with three parallel horizontal lines crossing images at given places. *, p < 0.05. D and E, fluorescence images of differentiating LUHMES cells (day 4) infected with lentiviruses expressing either GFP or α-Syn (WTS or E57K) at MOI 4 and MOI 2, respectively. GFP expression is shown in green (left-hand panels in D and E). Cells were stained with anti-β3-tubulin antibody (red), and nuclei were visualized using DAPI (blue; right-hand panels in D and E). At mild levels of α-Syn overexpression (MOI 2), the network morphology of LUHMES cells overexpressing E57K is markedly affected (E), whereas high levels of both WTS and E57K overexpression (MOI 4) cause strong neurite pathology (D). Scale bars, 100 μm. F and G, representative images of LUHMES cells infected with either GFP or α-Syn (WTS or E57K) LVs at MOI 2 and double-stained for β3-tubulin (red) and α-Syn (cyan) (F) or for Tau (red) and α-Syn (cyan) (G). Colocalization (highlighted with arrows on merged images) of α-Syn was detected with both β3-tubulin and Tau in all types of infected LUHMES cells, as determined by Pearson's overlap coefficient (POC). Pearson's overlap coefficient values shown represent a mean of three independent images. Nuclei were visualized using DAPI (blue). Scale bars, 20 μm.

