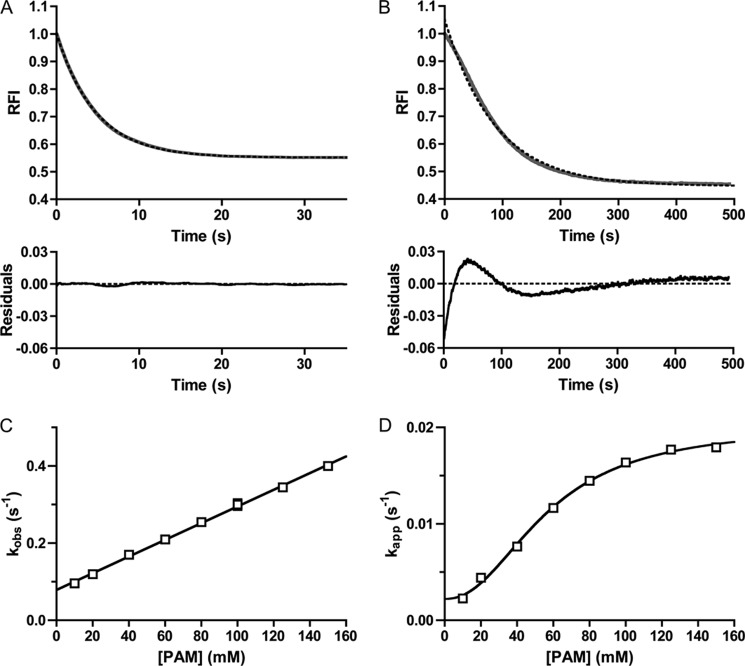
FIGURE 3.
Analysis of CheY and PhoBN time traces by fitting to a single exponential decay. Autophosphorylation time traces for reaction of 5 μm CheY (A) or 5 μm PhoBN (B) with 60 mm PAM are shown in gray. The best fit to a one-phase exponential decay is shown in dashed black lines. The rate constant from the fit is kobs for CheY and kapp for PhoBN. Residuals (the difference between the raw data and the one-exponential decay) are shown at the bottom. C, plot of kobs versus concentration of PAM for 5 μm CheY fit with linear regression (see Equation 3). The slope of the line gave kphos/KS, and the y intercept gave kdephos. Error bars represent standard deviation from duplicate experiments. D, plot of kapp versus concentration of PAM for 5 μm PhoBN fit with sigmoidal dose-response curve (see Equation 4). Error bars represent standard deviation from triplicate experiments. Reactions were performed in duplicate for A and C and in triplicate for B and D. Time traces represent the mean of multiple reactions, with standard deviations (not shown for clarity) that were less than 3% of the mean. Most error bars in C and D were smaller than data points.

