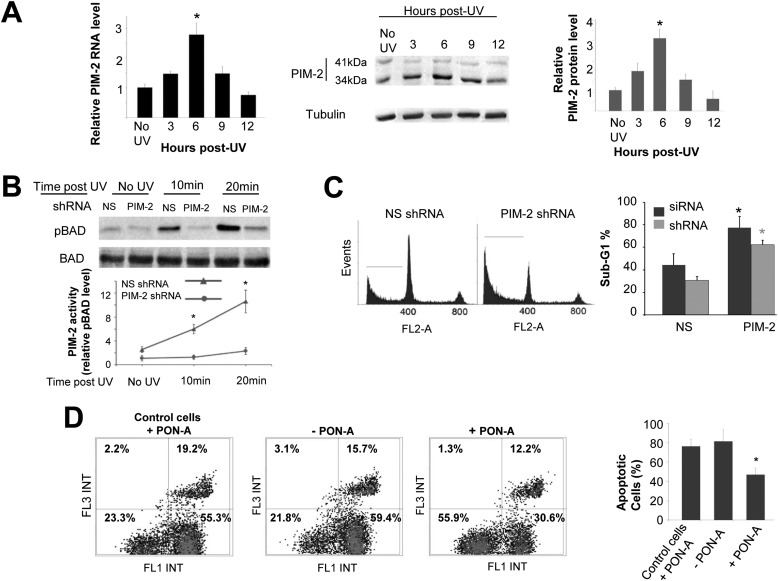
FIGURE 1.
Involvement of PIM-2 in the UV-induced DNA damage response. A, up-regulation of PIM-2 following exposure to UVC radiation (254 nm). Cells were irradiated at 50 mJ/cm2 and harvested at the indicated times postirradiation (control cells were not radiated). Left panel, real time PCR analysis of total RNA from the irradiated cells, using Pim-2-specific primers. Primers for the S12 gene were used for endogenous control. Middle panel, Western analysis of proteins extracted from the irradiated cells (40 μg) using antibodies against the PIM-2 protein. Anti-tubulin antibodies were used for equal loading control and normalization. Right panel, densitometric analysis of PIM-2 signal (34-kDa isoform) from gels such as that depicted in the middle panel. Signal intensity with no UV was determined as 1. B, increased activity of PIM-2 in UV-irradiated cells, judged by increased phosphorylation of BAD on Ser-75 (pBAD). Upper panel, Western analysis of pBAD in extracts of naïve U2OS cells treated with nonspecific shRNA (NS), or Pim-2-silenced cells (PIM-2), at the indicated postirradiation times. Anti-BAD antibodies were used for equal loading control and normalization. Lower panel, graphic representation of relative intensity of pBAD obtained by densitometric analysis of pBAD signal from gels such as that depicted in the upper panel. Signal intensity in Pim-2-silenced cell (Pim-2 shRNA) with of no UV was determined as 1. C, Pim-2 knockdown cells are more sensitive to UVC-induced apoptosis. Left panel, cell cycle FACS analysis of PI-stained cells, either silenced for Pim-2 or transfected with NS shRNA, 24 h postirradiation with UVC (50 mJ/cm2). The horizontal line in each pattern indicates the channels included in calculation of the sub-G1 phase. Right panel, percentage of cells at the sub-G1 phase, calculated from cell cycle patterns such as that presented in the left panel. Results of both shRNA and siRNA are shown. D, cells overexpressing PIM-2 exhibit better resistance to UVC induce apoptosis. Left panel, annexin V/PI FACS assay for cells either induced to overexpress the 41-kDa isoform of PIM-2 (+PON-A, 10 μm for 24 h) or not (−PON-A), 24 h postirradiation with UVC (50 mJ/cm2). Control cell cannot induce PIM-2 expression upon treatment with PON-A. Right panel, percentage of apoptotic cells (early + late apoptosis). In all panels, the histograms summarize data from three independent experiments. *, statistically significant differences, p < 0.05.

