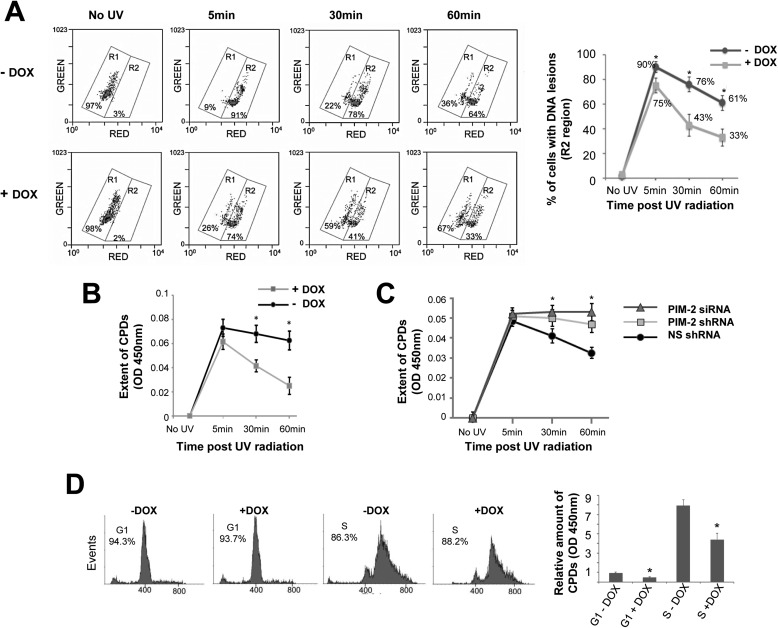
FIGURE 2.
Accelerated repair of UV-induced DNA lesions in PIM-2-expressing cells. A, monitoring DNA damage in PIM-2-overexpressing cells (+DOX) versus control cells (−DOX), exposed to UVC radiation (8 mJ/cm2), by alkaline unwinding flow cytometry. At the indicated time intervals postirradiation, cells were fixed, embedded in low temperature melting agarose, treated with alkaline buffer to unwind damaged DNA, stained with acridine orange, and analyzed by FACS for green and red fluorescence emitted from double- and single-stranded DNA, respectively. Left panel, region R1 represents distribution of undamaged cells, and region R2 represents distribution of damaged cells. The percentage of cells within each region is indicated. Right panel, percentage of cells with DNA lesions, calculated from FACS analyzes such as that depicted in the left panel. *, statistically significant differences, p < 0.05. B, direct ELISA assay for UV-induced CPDs in PIM-2-overexpressing cells (+DOX) versus control cells (−DOX), exposed to UVC radiation (8 mJ/cm2), using anti-CPD antibodies. *, statistically significant differences, p < 0.05. C, direct ELISA assay for UV-induced CPDs in Pim-2-silenced cells (Pim-2 shRNA and siRNA) versus control cells treated with NS shRNA, exposed to UVC radiation (4 mJ/cm2), using anti-CPD antibodies. D, the protective effect of PIM-2 overexpression is not cell cycle-dependent. Left panel, cells overexpressing PIM-2 (+DOX) and control cells (−DOX) were synchronized to either the G1 or S phase, using the double thymidine block method. Percentage of cells at either G1 or S phase is indicated. Right panel, relative amount of CPDs 45 min after UV radiation (8 mJ/cm2). CPDs in G1 synchronized control cells (G1-DOX) were determined as 1. *, statistically significant difference, p < 0.05.

