FIGURE 3.
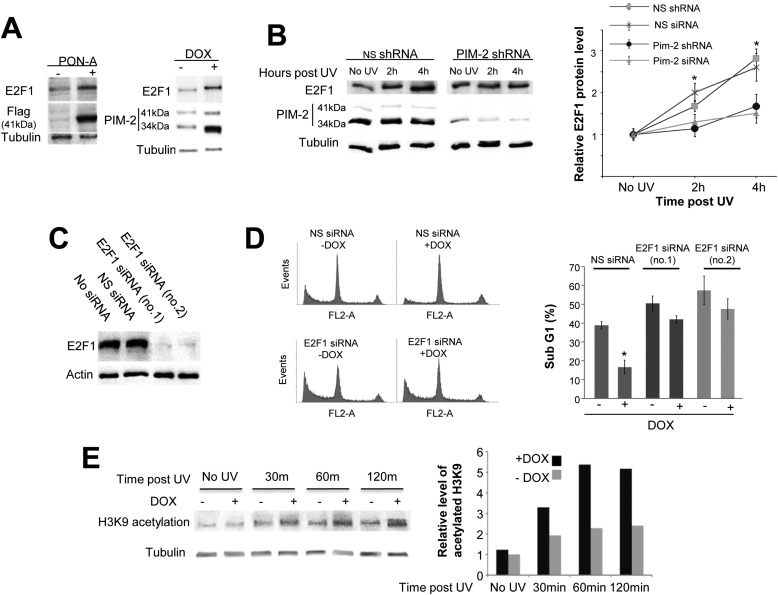
Involvement of E2F-1 in the PIM-2-dependent protection effect against UV-induced DNA damage. A, Western blot analysis (40 μg of total cell extracts) of E2F-1 levels in cells overexpressing either the 41-kDa isoform of PIM-2 (PON-A) or the 34-kDa isoform (DOX), using anti-E2F-1 antibodies. For detection of overexpressed PIM-2, anti-FLAG and anti-PIM-2 antibodies were used for the 41- and 34-kDa isoforms, respectively. Anti-tubulin antibodies were used for equal loading control and normalization. B, up-regulation of E2F-1 following exposure to UVC is delayed in Pim-2-silenced cells. Left panel, Western blot analysis of E2F-1 levels in cells either silenced for Pim-2 expression (Pim-2 shRNA) or cells transfected with NS shRNA as control, 2 and 4 h post-UVC irradiation (50 mJ/cm2). Anti-tubulin antibodies were used for equal loading control and normalization. Right panel, graphic representation of relative E2F-1 levels, obtained from densitometric analysis of gels such as that depicted in the left panel for Pim-2-silenced cells with either shRNA and siRNA. E2F-1 levels in nonirradiated cells were determined as 1. C, E2F-1 silencing using two unrelated sets of E2F-1-specific siRNAs (no.1 and no.2). Nonspecific siRNA was used for control. Anti-actin antibodies were used for equal loading control. D, left panel, cell cycle FACS analysis of PI-stained cells, under conditions of E2F-1 knockdown (E2F-1 siRNA), with (+DOX) and without (−DOX) PIM-2 overexpression, 24 h postirradiation with UVC (50 mJ/cm2). Nonspecific siRNA (NS siRNA) was used as control. Right panel, percentage of cells at the sub-G1 phase, calculated from cell cycle patterns such as those presented in the left panel, for E2F-1-silenced cells with both sets of siRNA. Graphic representations in B and D summarize data from three independent experiments. *, statistically significant differences, p < 0.05. E, left panel, Western bolt analysis of histone H3 Lys-9 (H3K9) acetylation in cells overexpressing the 34-kDa isoform of PIM-2 (+DOX), versus control cell (−DOX), at the indicated time intervals postradiation (50 mJ/cm2). Anti-tubulin antibodies were used for equal loading control and normalization. Right panel, graphic representation of relative acetylated H3K9 levels at different time intervals following radiation, obtained by densitometric analysis of signals in the blot presented in the left panel. Level of acetylated H3K9 in unirradiated control cells (−DOX) was determined as 1.

