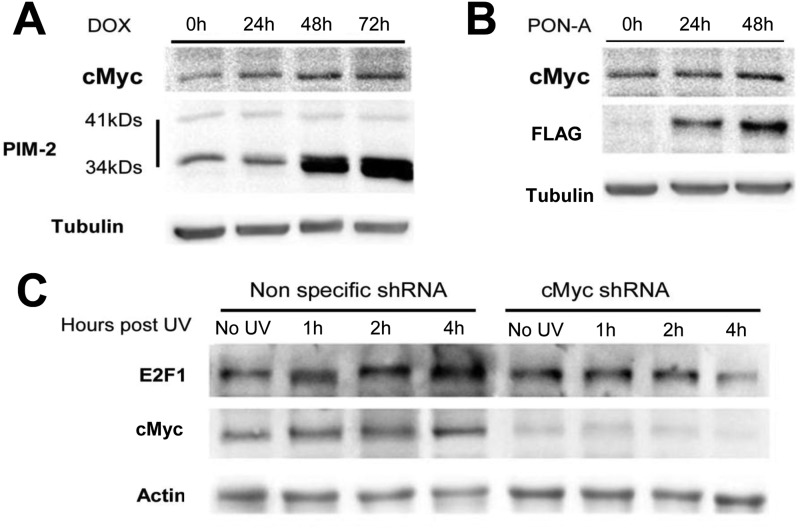
FIGURE 8.
Increased c-Myc levels upon PIM-2 overexpression and UV radiation. A and B, Western blot analysis (40 μg of total cell extracts) of c-Myc levels in cells overexpressing either the 34-kDa isoform (1 μg/ml DOX for the indicated times) (A) or the 41-kDa isoform of PIM-2 (10 μm PON-A for the indicated times) (B). Anti-PIM-2 and anti-FLAG antibodies were used for detection of the 34- and 41-kDa isoforms, respectively. Anti-tubulin antibodies were used for equal loading control and normalization. C, Western blot analysis (40 μg of total cell extracts) of c-Myc and E2F-1 levels in cells either silenced for c-Myc (cMyc shRNA) or transfected with nonspecific shRNA as control, 1, 2, and 4 h post-UVC irradiation (50 mJ/cm2). Anti-actin antibodies were used for equal loading control and normalization.

